Fig. 13.
Download original image
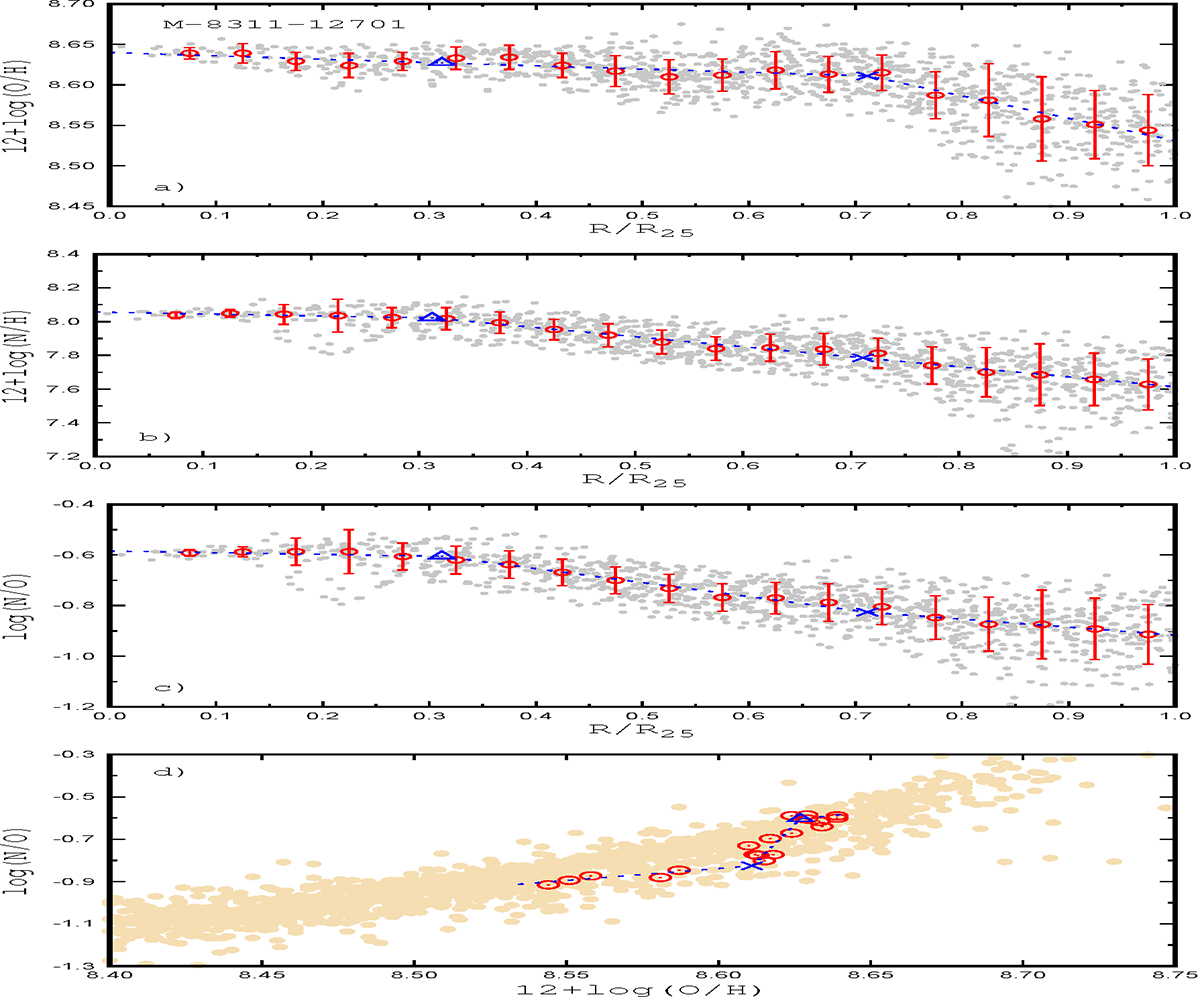
M-8311-12701 is an example of a galaxy with an LS-type abundance distribution. Panel a: Radial oxygen abundance distribution. The grey points denote the abundances for the individual spaxels, the red circles are the median values of the O/H in bins of 0.05 dex in the fractional radius R/R25, and the bars show the scatter in the O/H about the median value in the bins. The line shows the adopted relation for the radial abundance distribution. The abundance at the radius Rb, OH is marked by the cross and at the radius Rb, NH by the triangle. Panel b: Same as panel a, but for nitrogen abundance. Panel c: Same as panel a, but for the N/O ratio. Panel d: N/O vs. O/H diagram. The yellow points denote H II regions in nearby galaxies (compilation in Pilyugin & Grebel 2016). The other designations are the same as in panel a.
Current usage metrics show cumulative count of Article Views (full-text article views including HTML views, PDF and ePub downloads, according to the available data) and Abstracts Views on Vision4Press platform.
Data correspond to usage on the plateform after 2015. The current usage metrics is available 48-96 hours after online publication and is updated daily on week days.
Initial download of the metrics may take a while.