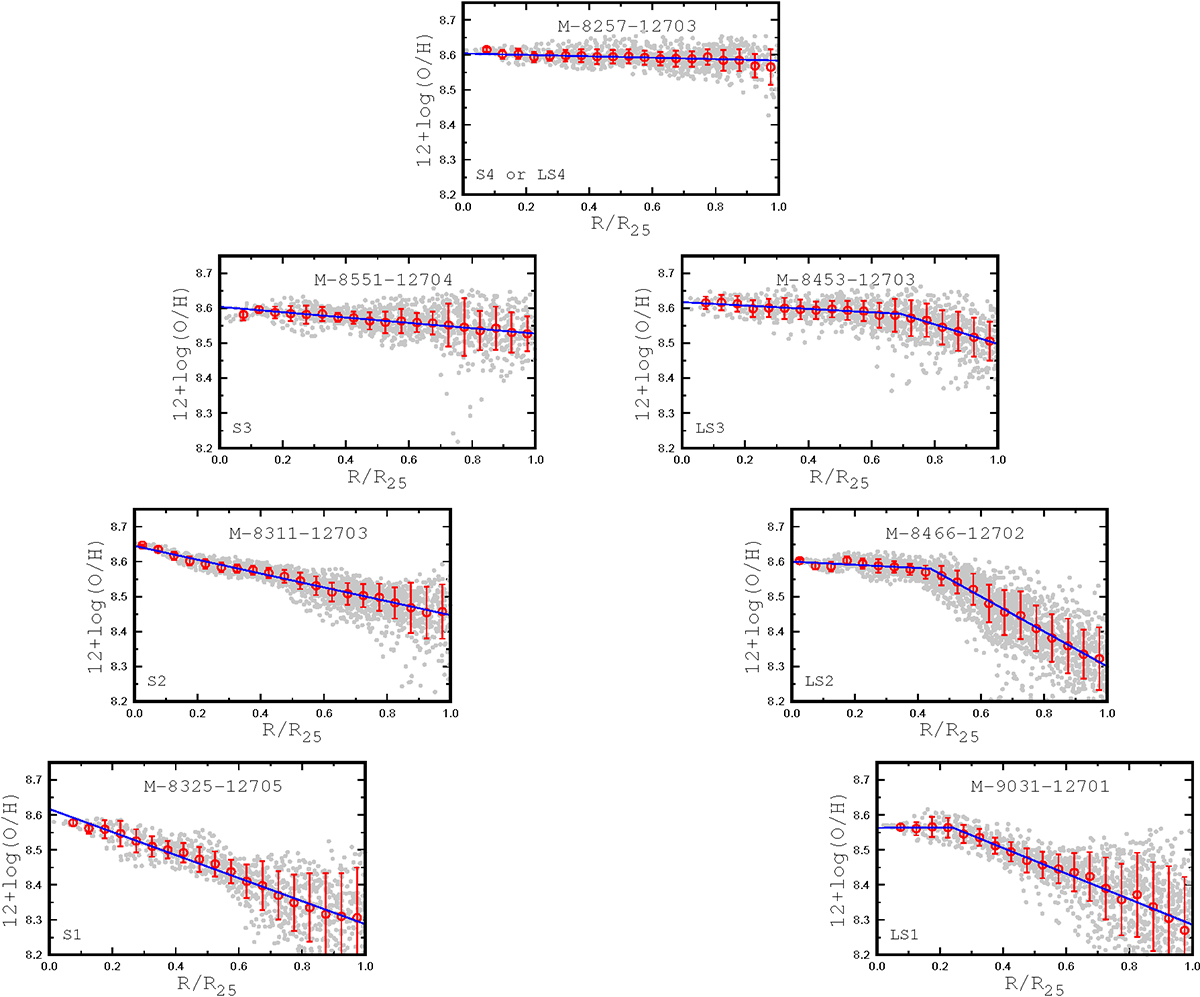
Fig. 1.
Download original image
Two sequences of galaxies with different shapes of the metallicity gradients. Each panel shows the radial oxygen abundance distribution in the galaxy. The left panels show the galaxies for which the (negative) gradient is well approximated by a single linear relation across the whole disc, i.e. the S (slope) gradient. The right panels show the galaxies in which the metallicity in the inner region of the disc (R < Rb, OH) is at (nearly) constant level and the gradient is negative at larger radii, the LS gradient. The grey points denote the abundances for the individual spaxels, the red circles are the median values of the O/H in bins of 0.05 in the fractional radius R/R25, and the bars show the scatter in O/H about the median value in the bins. The line shows the adopted relation for the radial abundance distribution. The gradients flatten along the sequence of galaxies with the S gradients: −0.329 dex/R25 in S1 (M-8325-12705), −0.199 dex/R25 in S2 (M-8311-12703), and −0.075 dex/R25 in S3 (M-8551-12704). The size of the inner region with a constant level of abundance Rb, OH increases along the sequence of galaxies with the LS gradients: 0.24 R25 in LS1 (M-9031-12701), 0.44 R25 in LS2 (M-8466-12702), and 0.69 R25 in LS3 (M-8453-12703). Galaxy M-8257-12703 can be considered either as the limiting case of the sequence of galaxies with the S gradients (gradient is close to zero, grad = −0.019 dex/R25) or as the limiting case of the sequence of galaxies with an LS gradients (Rb, OH = 1.0 R25).
Current usage metrics show cumulative count of Article Views (full-text article views including HTML views, PDF and ePub downloads, according to the available data) and Abstracts Views on Vision4Press platform.
Data correspond to usage on the plateform after 2015. The current usage metrics is available 48-96 hours after online publication and is updated daily on week days.
Initial download of the metrics may take a while.