Fig. 8.
Download original image
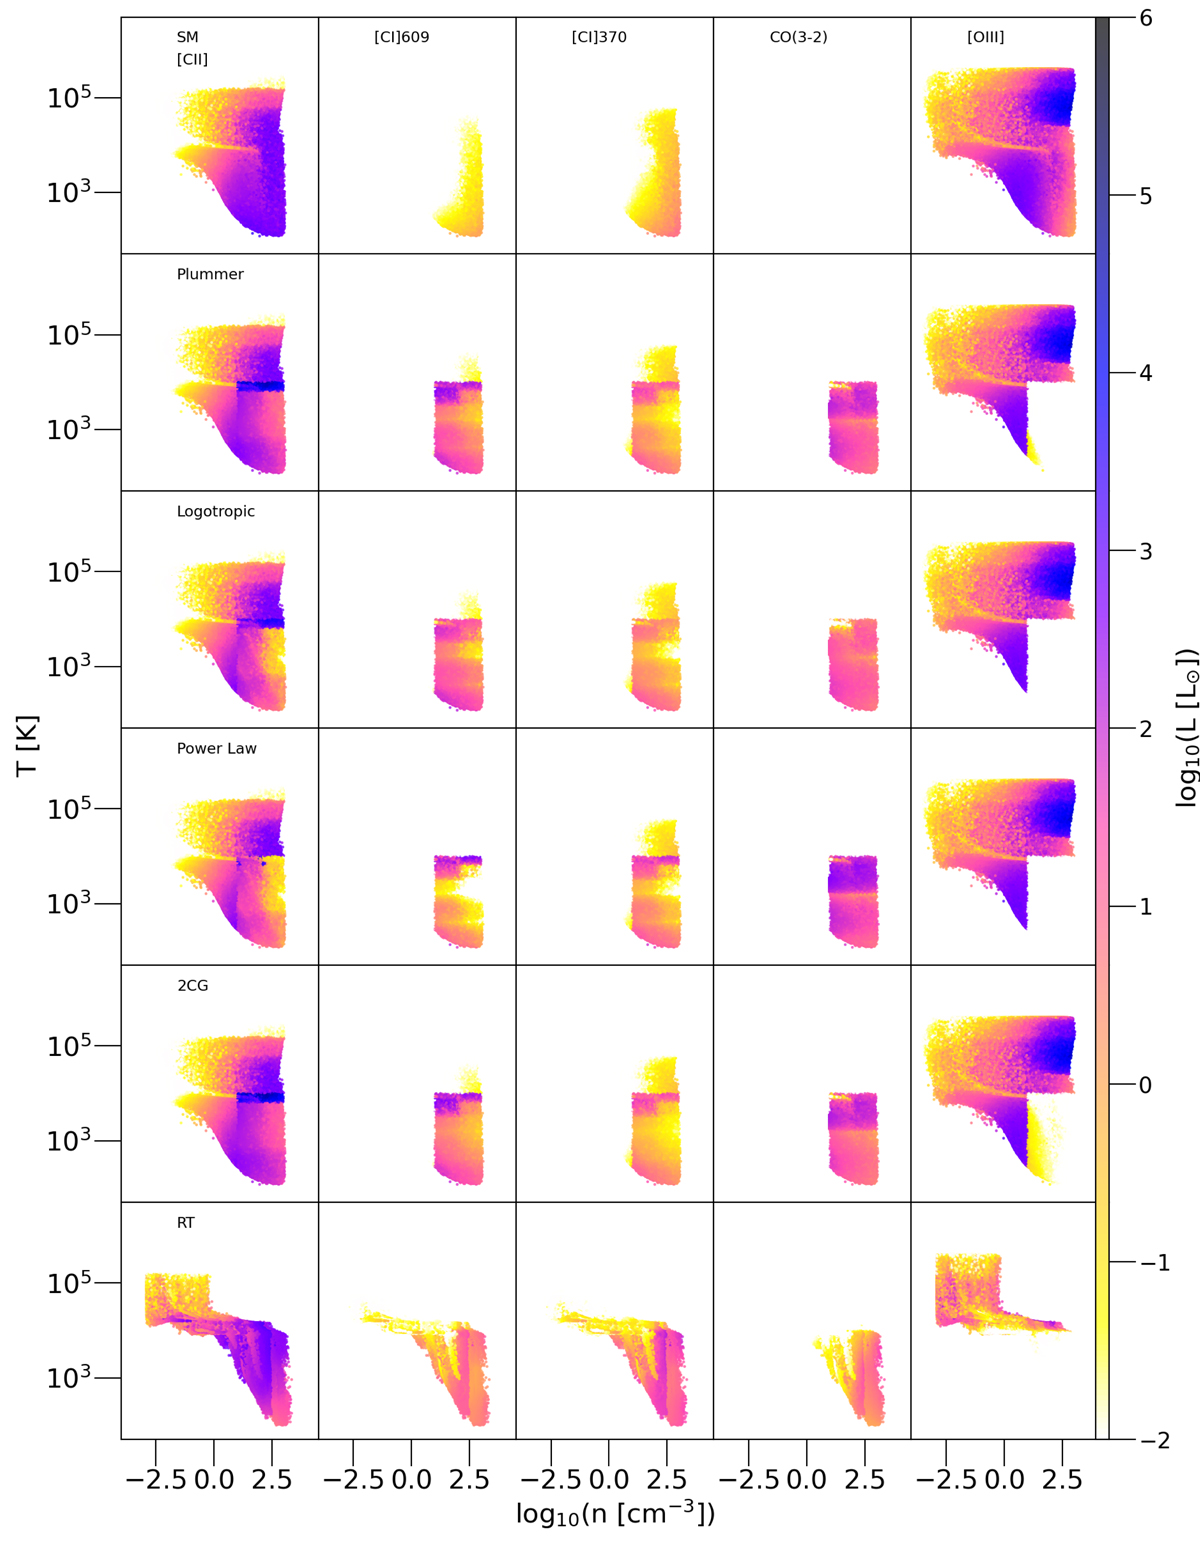
Density–temperature (n − T) phase diagram of all six models used in this analysis. The rows show the different models, while the columns represent the different synthetic emission lines. The colours represent the emission in a particular line. For the MPM the densities do not directly correspond to those taken directly from the simulations, as they are given sub-grid density profiles, as described in Sect. 3.2. The bottom row corresponds to the fiducial RT model, and it shows how the RT post-processing produces densities and temperatures that differ from the original simulation.
Current usage metrics show cumulative count of Article Views (full-text article views including HTML views, PDF and ePub downloads, according to the available data) and Abstracts Views on Vision4Press platform.
Data correspond to usage on the plateform after 2015. The current usage metrics is available 48-96 hours after online publication and is updated daily on week days.
Initial download of the metrics may take a while.