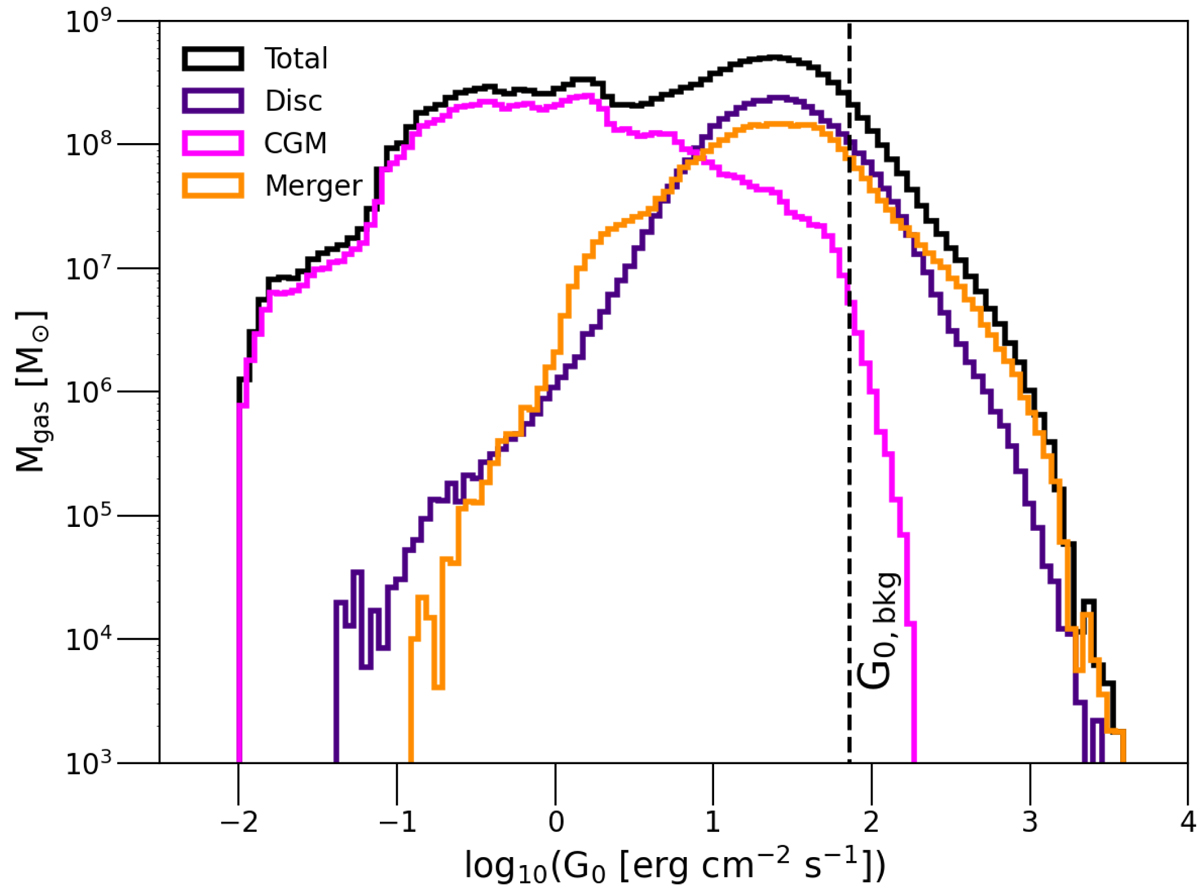
Fig. 6.
Download original image
Distribution of the log(G0) values of the PONOS simulation after RT post-processing. In black the distribution for the whole halo is shown, while in purple the disc, in orange the merger component, and in pink the CGM is represented. The high log(G0) values are part of the disc and mergers, where the gas experiences UV radiation from young stars. The black dashed line represents the background radiation used in the SM and MPM.
Current usage metrics show cumulative count of Article Views (full-text article views including HTML views, PDF and ePub downloads, according to the available data) and Abstracts Views on Vision4Press platform.
Data correspond to usage on the plateform after 2015. The current usage metrics is available 48-96 hours after online publication and is updated daily on week days.
Initial download of the metrics may take a while.