Fig. 19.
Download original image
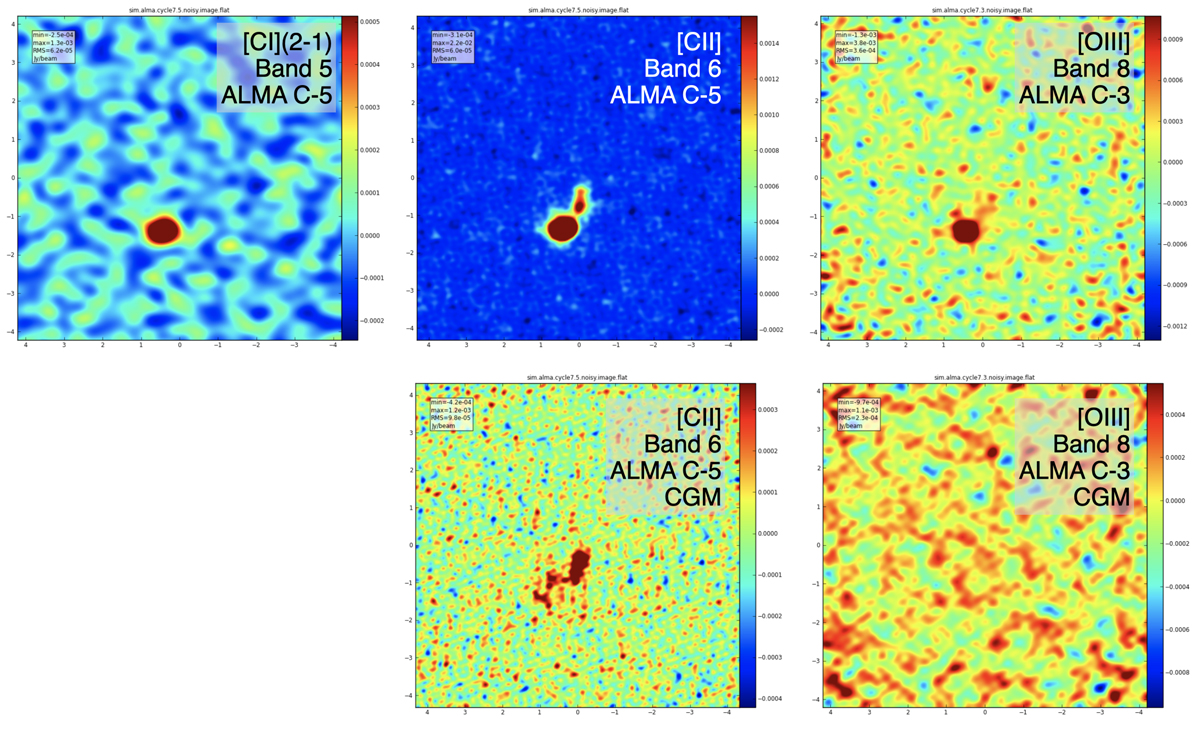
Simulated ALMA observations of PONOS, performed using CASA. The field of view of the input image includes the main disc, and mergers A and B. Note that the output CASA mocks are flipped and rotated by 180 deg with respect to the maps shown in Figs. 11 and 12: in these mocks, merger A is to the north and the accreting filament to the south, while the main galaxy disc is still to the left (east) and merger B to the right (west). Upper left: ALMA mock map of the total [CI](2−1) line emission, at an observed frequency of 107.91 GHz (Band 5). The simulation uses the ALMA C-5 array configuration (0.30″ angular resolution, 3.62″ maximum recoverable scale (MRS)). Upper middle: total [CII] line mock map, at an observed frequency of 253.40 GHz (Band 6). The simulation uses the ALMA C-5 array configuration (0.24″ angular resolution, 2.91″ MRS). Upper right: total [OIII] line mock map, at an observed frequency of 460 GHz (Band 8). The simulation uses the ALMA C-3 array configuration (0.31″ angular resolution, 3.51″ MRS). Bottom panels: show the corresponding [CII] and [OIII] mocks obtained for the CGM component only (see Fig. 12). In all CASA simulations, the total integration time was set equal to 10 h (without overheads), and we simulated one velocity channel of 50 km s−1 centred at v = 0 km s−1.
Current usage metrics show cumulative count of Article Views (full-text article views including HTML views, PDF and ePub downloads, according to the available data) and Abstracts Views on Vision4Press platform.
Data correspond to usage on the plateform after 2015. The current usage metrics is available 48-96 hours after online publication and is updated daily on week days.
Initial download of the metrics may take a while.