Fig. 18.
Download original image
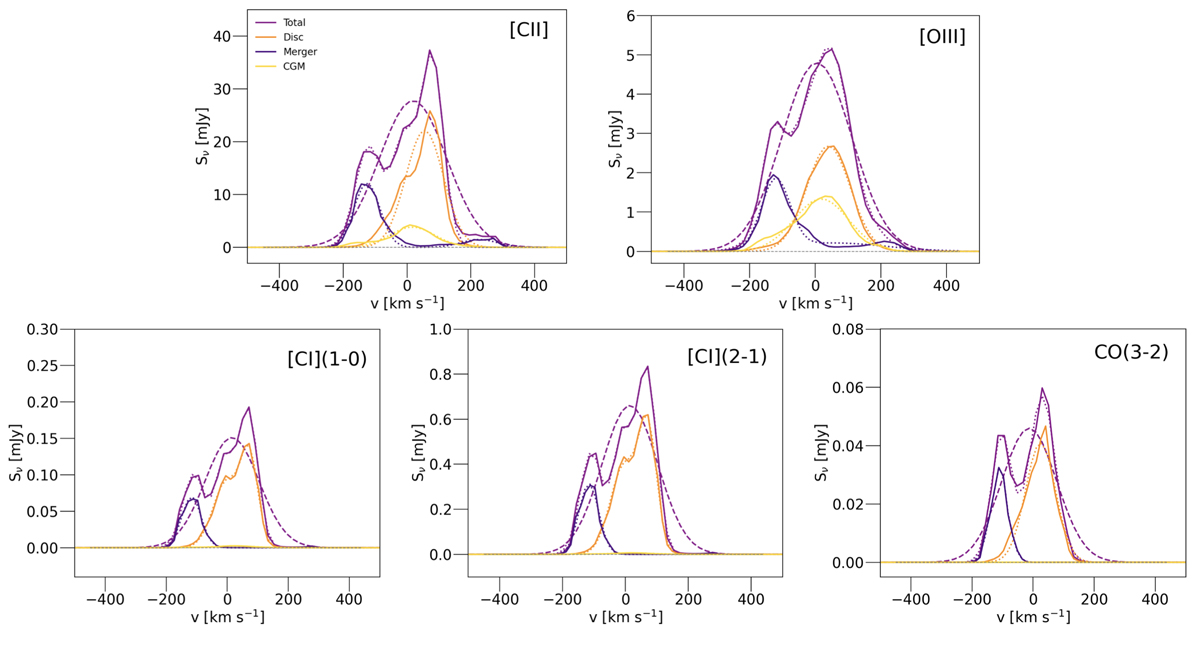
Simulated spectra of each of the modelled emission lines (fiducial RT model). The total emission is shown in purple, the emission from the central disc in orange, the ISM of the merger components in indigo, and the CGM in yellow. The dotted lines show the multi-component Gaussian line fits performed separately for the spectra of each component. The purple dashed lines show single-Gaussian fits of the total integrated spectra, which we executed with the goal of obtaining an FWHM and peak density value.
Current usage metrics show cumulative count of Article Views (full-text article views including HTML views, PDF and ePub downloads, according to the available data) and Abstracts Views on Vision4Press platform.
Data correspond to usage on the plateform after 2015. The current usage metrics is available 48-96 hours after online publication and is updated daily on week days.
Initial download of the metrics may take a while.