Fig. 16.
Download original image
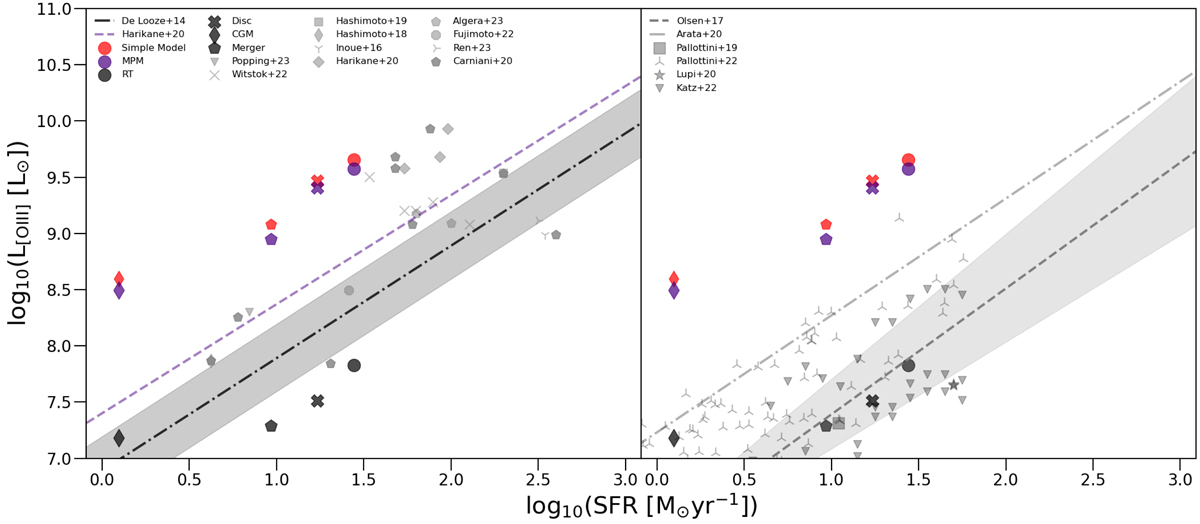
[OIII]88 μm line luminosity as a function of SFR. Our modelling results based on the PONOS simulation are compared with observations in the left panel, and with other theoretical works in the right panel. Symbols and colour-coding are the same as in Fig. 15. As was also seen in Fig. 7, the [OIII] luminosities of the MPMs does not change much for different sub-grid density profiles for the dense gas, and thus we show the MPM emission in one data point. The MPMs are represented in indigo. The observational data in the left panel are taken from: Popping (2023; upper limit of a z = 13 galaxy), Witstok et al. (2022; z = 6 − 7), Hashimoto et al. (2019; z ∼ 7), Hashimoto et al. (2018; z = 9), Inoue et al. (2016; z ∼ 7), Algera et al. (2024; z = 7.3), Fujimoto et al. (2022; z = 8.4), Ren et al. (2023; z = 7.2), and Harikane et al. (2020; z ∼ 6). The relation reported in the left panel are the one derived by De Looze et al. (2014) and by Harikane et al. (2020). On the right panel, we compare our results to the simulation results by Pallottini et al. (2019, 2022), Katz et al. (2022), and Lupi et al. (2020), the relation by Arata et al. (2020) in dot-dashed, and the relation reported is the one fitted by Olsen et al. (2017) for their z = 6 simulated galaxies.
Current usage metrics show cumulative count of Article Views (full-text article views including HTML views, PDF and ePub downloads, according to the available data) and Abstracts Views on Vision4Press platform.
Data correspond to usage on the plateform after 2015. The current usage metrics is available 48-96 hours after online publication and is updated daily on week days.
Initial download of the metrics may take a while.