Fig. 15.
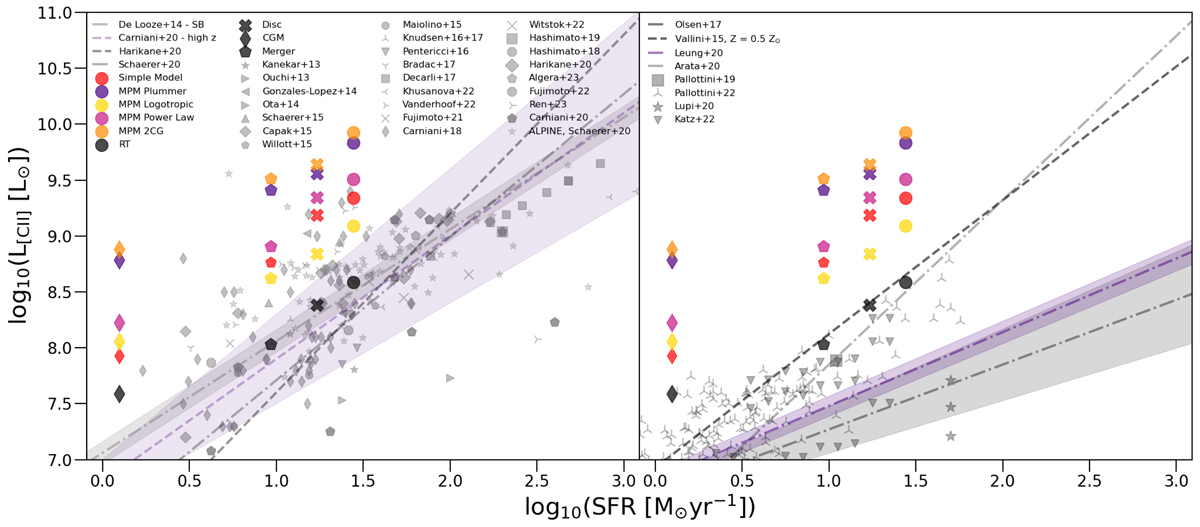
Download original image
[CII] line luminosity as a function of the SFR. In the left panel, our models are compared with observational constraints available from the literature at a similar redshift, while the right panel shows the comparison with other theoretical works. The circles represent the whole halo, crosses represent the main disc, and the pentagon the merging companions A and B. The CGM is shown using diamond symbols. The observational data are taken from: Kanekar et al. (2013) at z = 6.5, Ouchi et al. (2013) at z = 6.5, González-López et al. (2014) at z = 6.5 − 11, Ota et al. (2014) at z = 6.9, Schaerer et al. (2015)z = 6.8 − 7.5, Capak et al. (2015) for z = 5.1 − 5.7, Willott et al. (2015) for z = 6, Maiolino et al. (2015) for z = 6.8 − 7.1, Knudsen et al. (2016, 2017) for z = 6 − 7.6, Pentericci et al. (2016) for z = 6.6 − 7.1, Bradač et al. (2017) for z = 6.7, Decarli et al. (2017) for z = 6 − 6.6, Khusanova et al. (2022) for z = 6, Vanderhoof et al. (2022) for z = 4.5, Fujimoto et al. (2021) for z = 6, Witstok et al. (2022) for z = 6 − 7, Hashimoto et al. (2019) for z ∼ 7, Harikane et al. (2020) for z ∼ 6, the ALPINE data for z = 4 − 8, Schaerer et al. (2020), Algera et al. (2024) for z = 7.3, Fujimoto et al. (2022) for z = 8.4, Ren et al. (2023) for z = 7.2, and Carniani et al. (2018) for z = 5 − 7. The relation shown in grey is by De Looze et al. (2014) for SB galaxies, and the relation shown in purple by Carniani et al. (2020) for high-redshift galaxies. In addition, on the right panel, we compare our results to simulation data by Pallottini et al. (2019, 2022); Katz et al. (2022) and Lupi et al. (2020). The relation by Vallini et al. (2015) based on physical motivated models for a metallicity of Z = 0.5 Z⊙ can be seen in grey dashed, the relation by Arata et al. (2020) in dot-dashed, the relation found by Leung et al. (2020) in purple, and the Olsen et al. (2018) data in grey dot-dashed.
Current usage metrics show cumulative count of Article Views (full-text article views including HTML views, PDF and ePub downloads, according to the available data) and Abstracts Views on Vision4Press platform.
Data correspond to usage on the plateform after 2015. The current usage metrics is available 48-96 hours after online publication and is updated daily on week days.
Initial download of the metrics may take a while.