Fig. 13.
Download original image
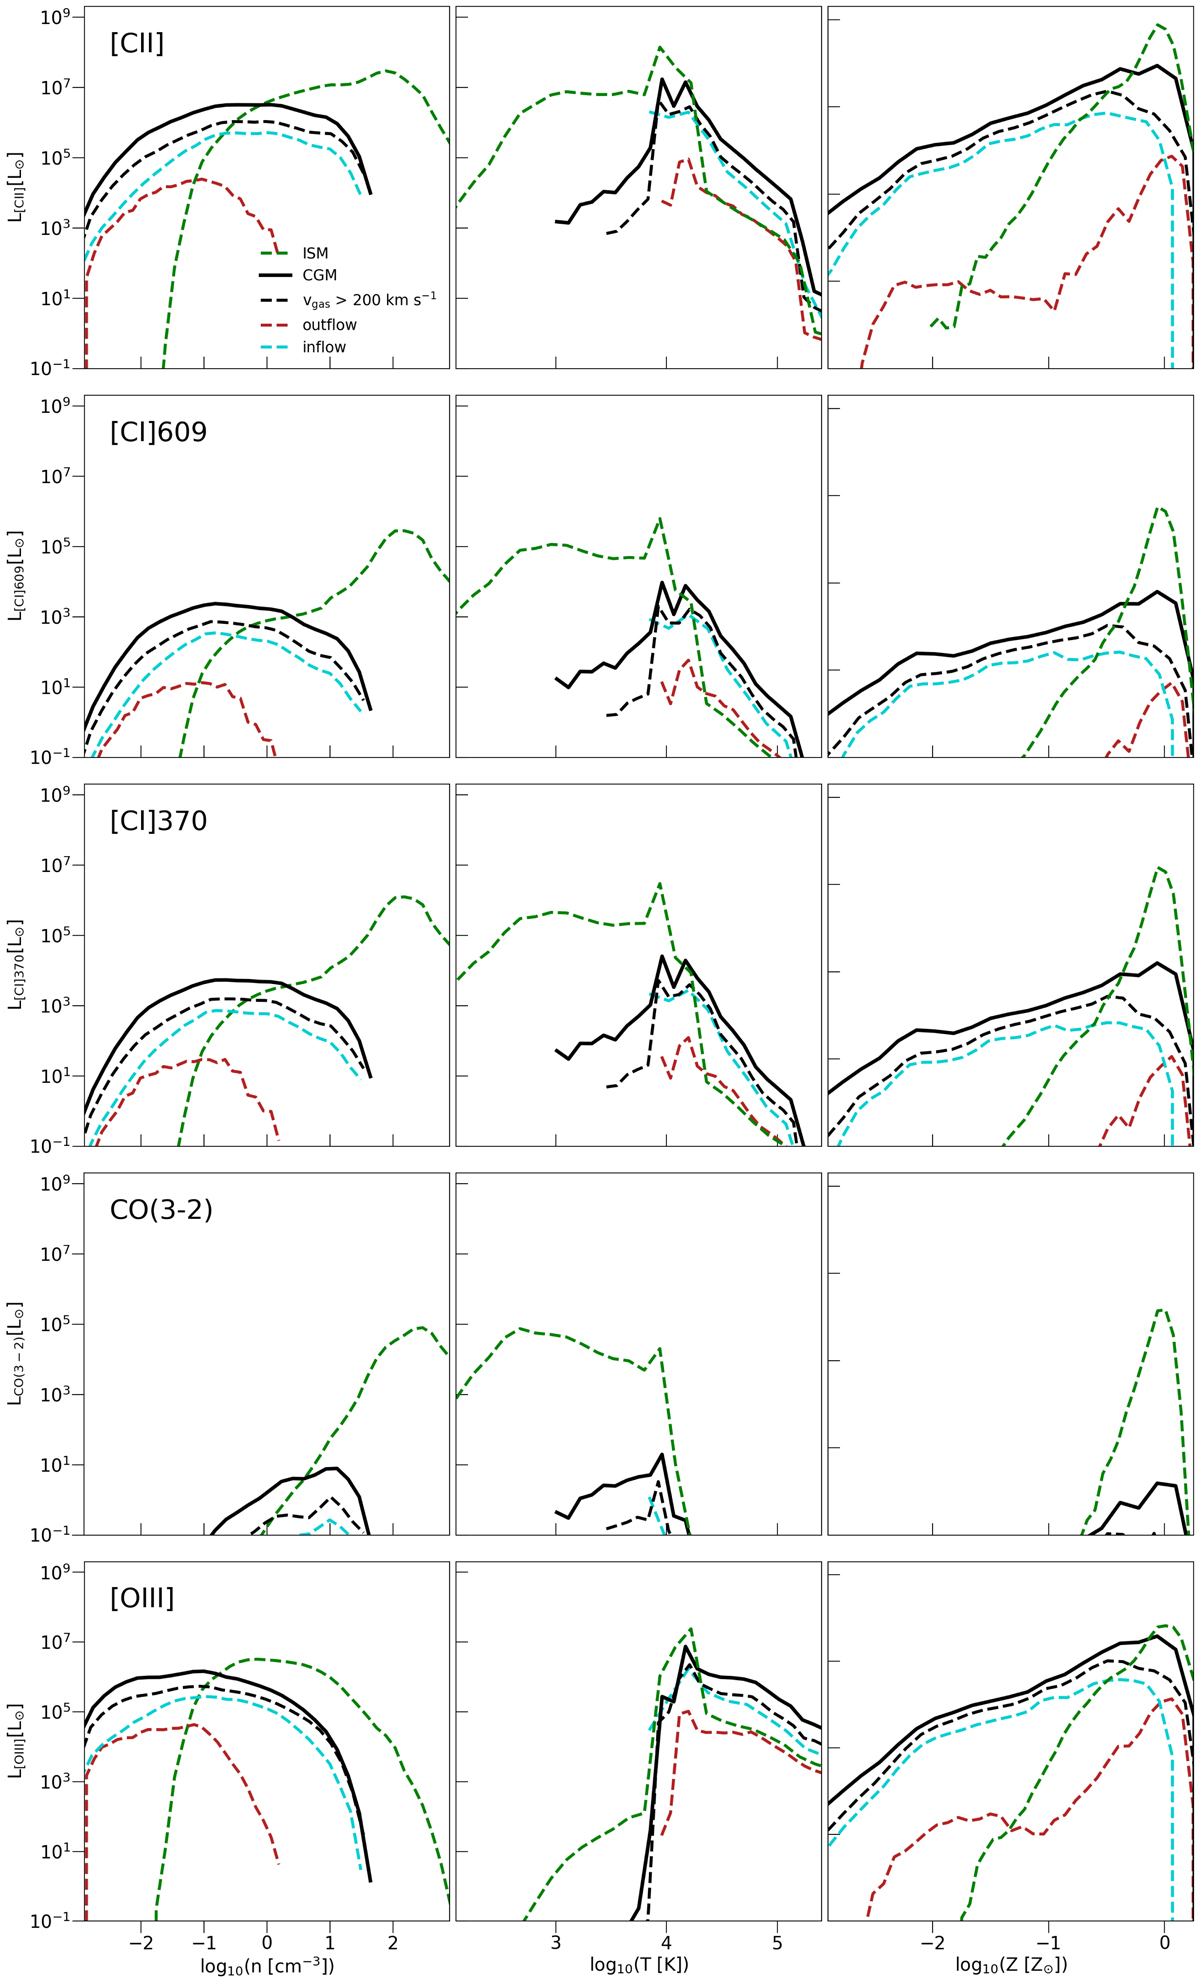
Line luminosities of the CGM plotted as a function of gas number density (left column), gas temperature (middle column) and gas metallicity (right column). The lines are also divided into the contribution from different CGM components as well as the main disc, where the black solid line shows the total CGM emission, the dashed black line shows the emission of high velocity CGM gas (v > 200 km s−1), outflowing high velocity gas in the dashed red line, inflowing high velocity gas in the blue dashed line and as a reference the disc/ISM component in dashed green.
Current usage metrics show cumulative count of Article Views (full-text article views including HTML views, PDF and ePub downloads, according to the available data) and Abstracts Views on Vision4Press platform.
Data correspond to usage on the plateform after 2015. The current usage metrics is available 48-96 hours after online publication and is updated daily on week days.
Initial download of the metrics may take a while.