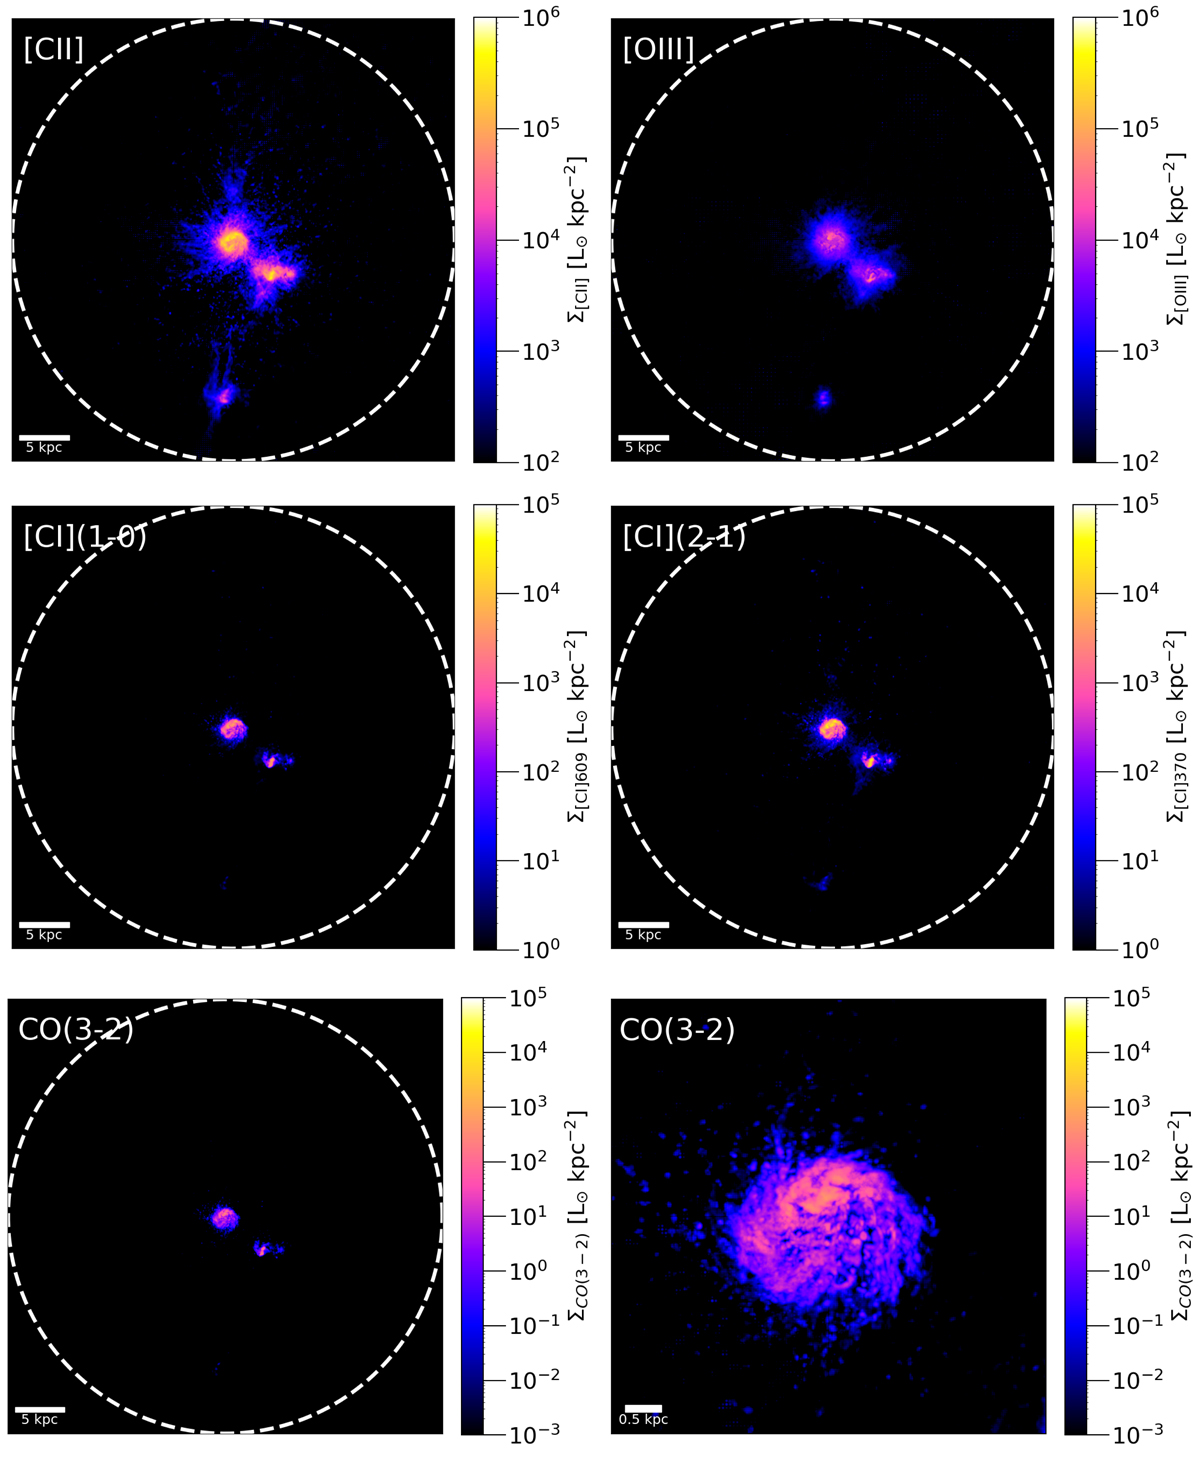
Fig. 11.
Download original image
Line emission maps obtained with the fiducial RT model. The circles in each plot mark Rvir. The top-left panel shows [CII], which is clearly extended and clumpy in appearance, with most of its emission originating from the main disc and merger components, and bridges of gas in between. The top-right panel shows the [OIII] map, which is fainter than in the other models tested in this study (see e.g. Fig. A.1 showing the same maps obtained for the MPM 2-component Gaussian model). [OIII] is extended, although less than [CII], and traces warm-ionised gas rather than the cold neutral gas traced by [CII]. The central maps show the [CI]609 μm and [CI]370 μm transitions, which are also extended, although fainter than [CII] (note the different surface luminosity scaling). The bottom panels show the CO(3−2) maps. The lowest plot on the right shows the CO(3−2) emission zoomed in on the main disc. As discussed in the main text, CO is faint in the RT model, and concentrated in the main disc and merger components. There are faint clouds of CO(3−2) emission in the CGM, overlapping with regions with relatively high [CI] emission.
Current usage metrics show cumulative count of Article Views (full-text article views including HTML views, PDF and ePub downloads, according to the available data) and Abstracts Views on Vision4Press platform.
Data correspond to usage on the plateform after 2015. The current usage metrics is available 48-96 hours after online publication and is updated daily on week days.
Initial download of the metrics may take a while.