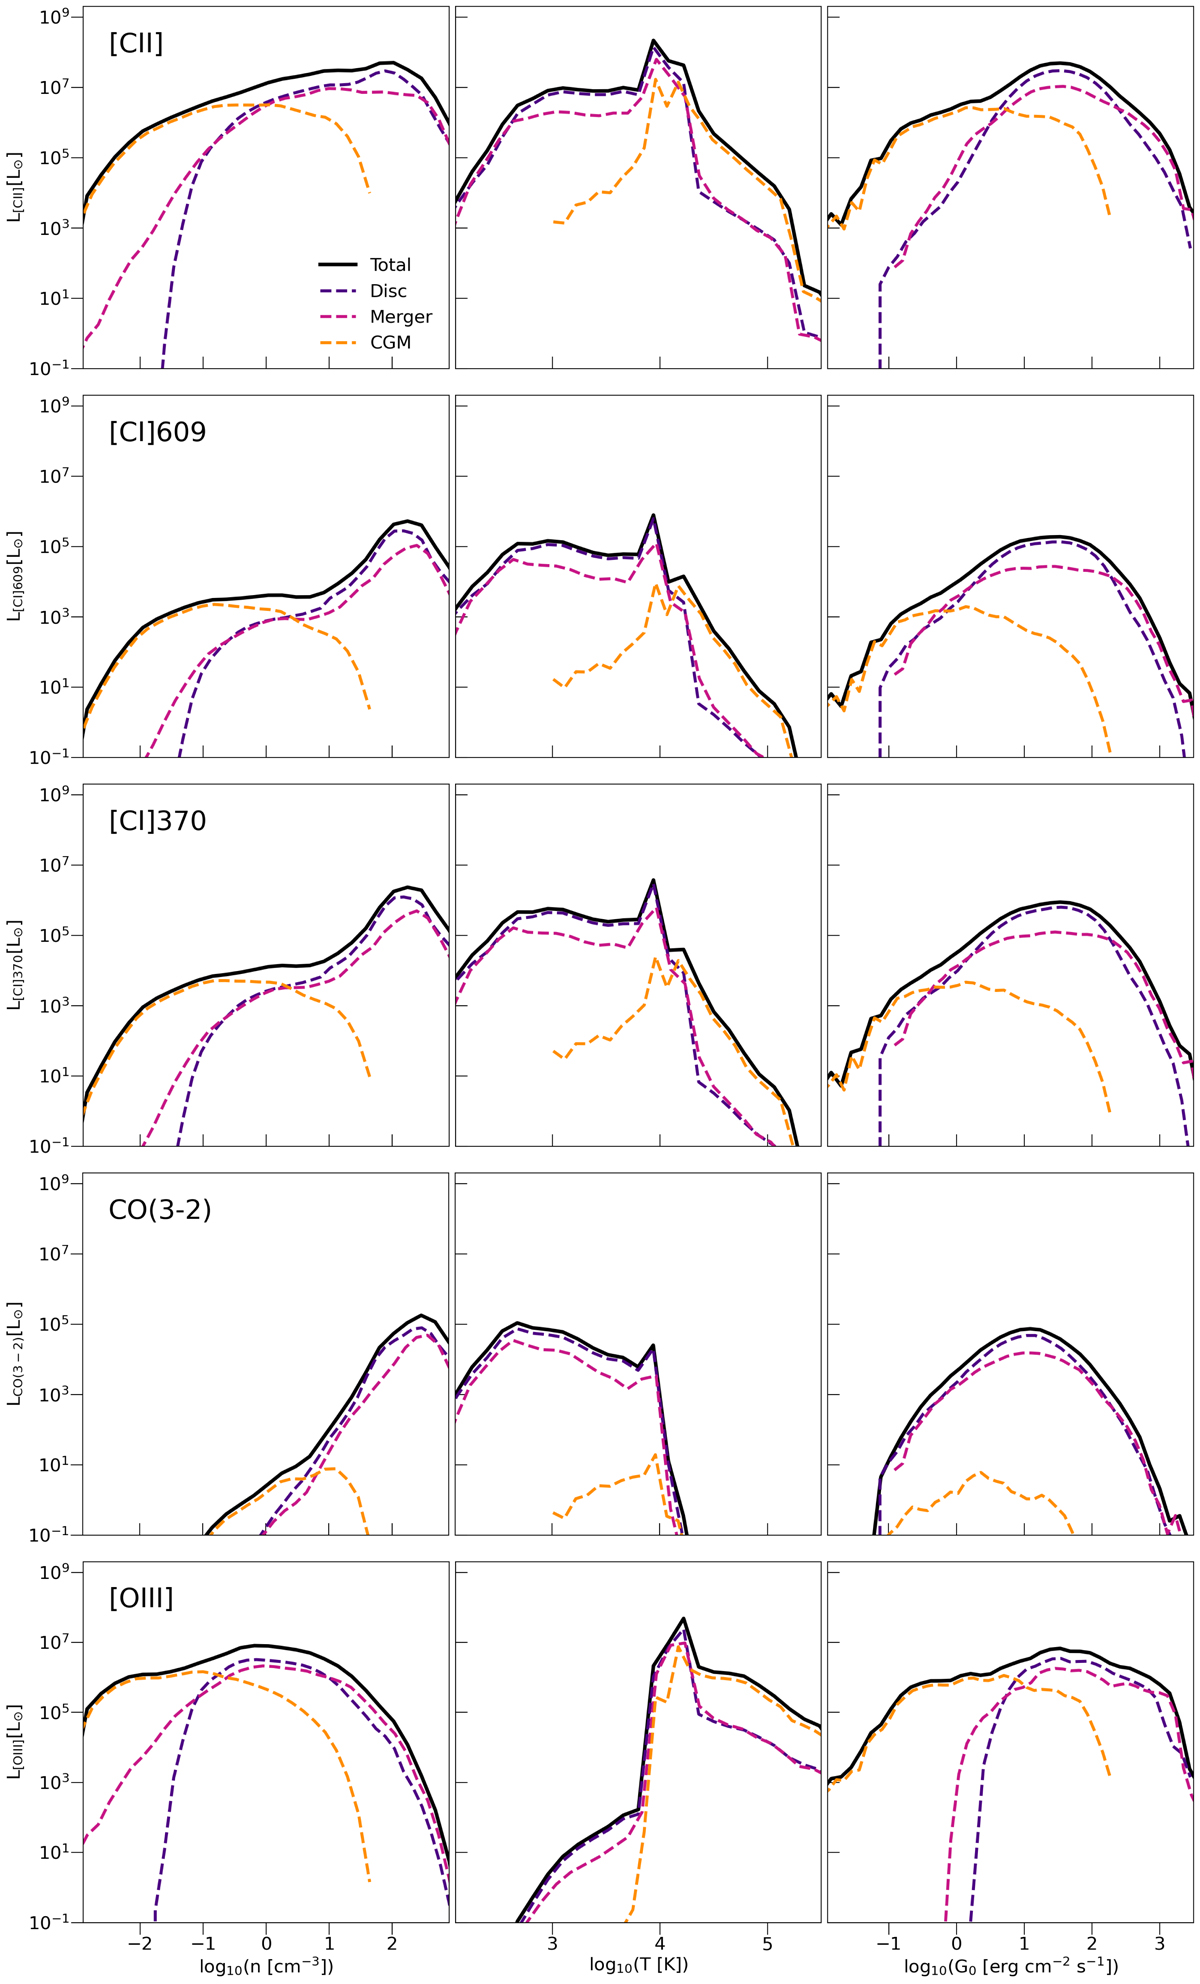
Fig. 10.
Download original image
Line luminosities plotted as a function of gas number density (left column), gas temperature (middle column) and incident radiation field (right column). The lines are also divided into the contribution from different halo components, where the black solid line shows the total emission from the whole simulation box, the dashed purple line shows the main disc emission, the two mergers are plotted using a magenta dashed line, and the CGM is plotted using a dashed orange line.
Current usage metrics show cumulative count of Article Views (full-text article views including HTML views, PDF and ePub downloads, according to the available data) and Abstracts Views on Vision4Press platform.
Data correspond to usage on the plateform after 2015. The current usage metrics is available 48-96 hours after online publication and is updated daily on week days.
Initial download of the metrics may take a while.