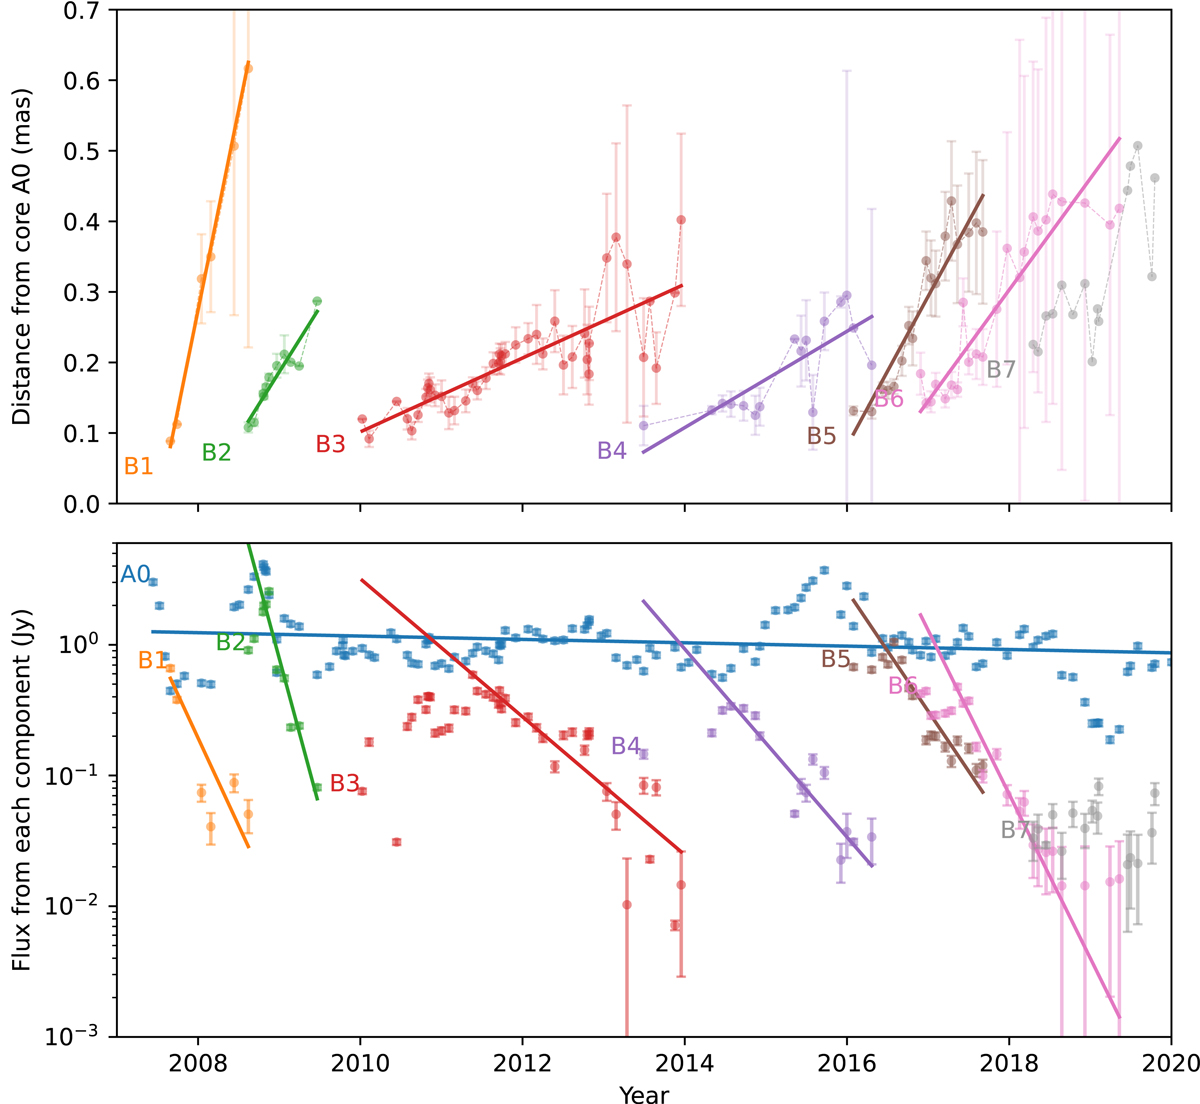
Fig. 9.
Download original image
Observed distance from core (top) and flux density (bottom) for every one of the identified component as a function of time, together with a linear weighted fit to knot distance and logarithmic fit to flux. The fit to the flux is done taking into account only the points after the peak of emission of each component. This was done for all components except B7, which due to its low flux, did not have enough points after the peak with low enough uncertainty to perform a fit.
Current usage metrics show cumulative count of Article Views (full-text article views including HTML views, PDF and ePub downloads, according to the available data) and Abstracts Views on Vision4Press platform.
Data correspond to usage on the plateform after 2015. The current usage metrics is available 48-96 hours after online publication and is updated daily on week days.
Initial download of the metrics may take a while.