Open Access
Fig. 8.
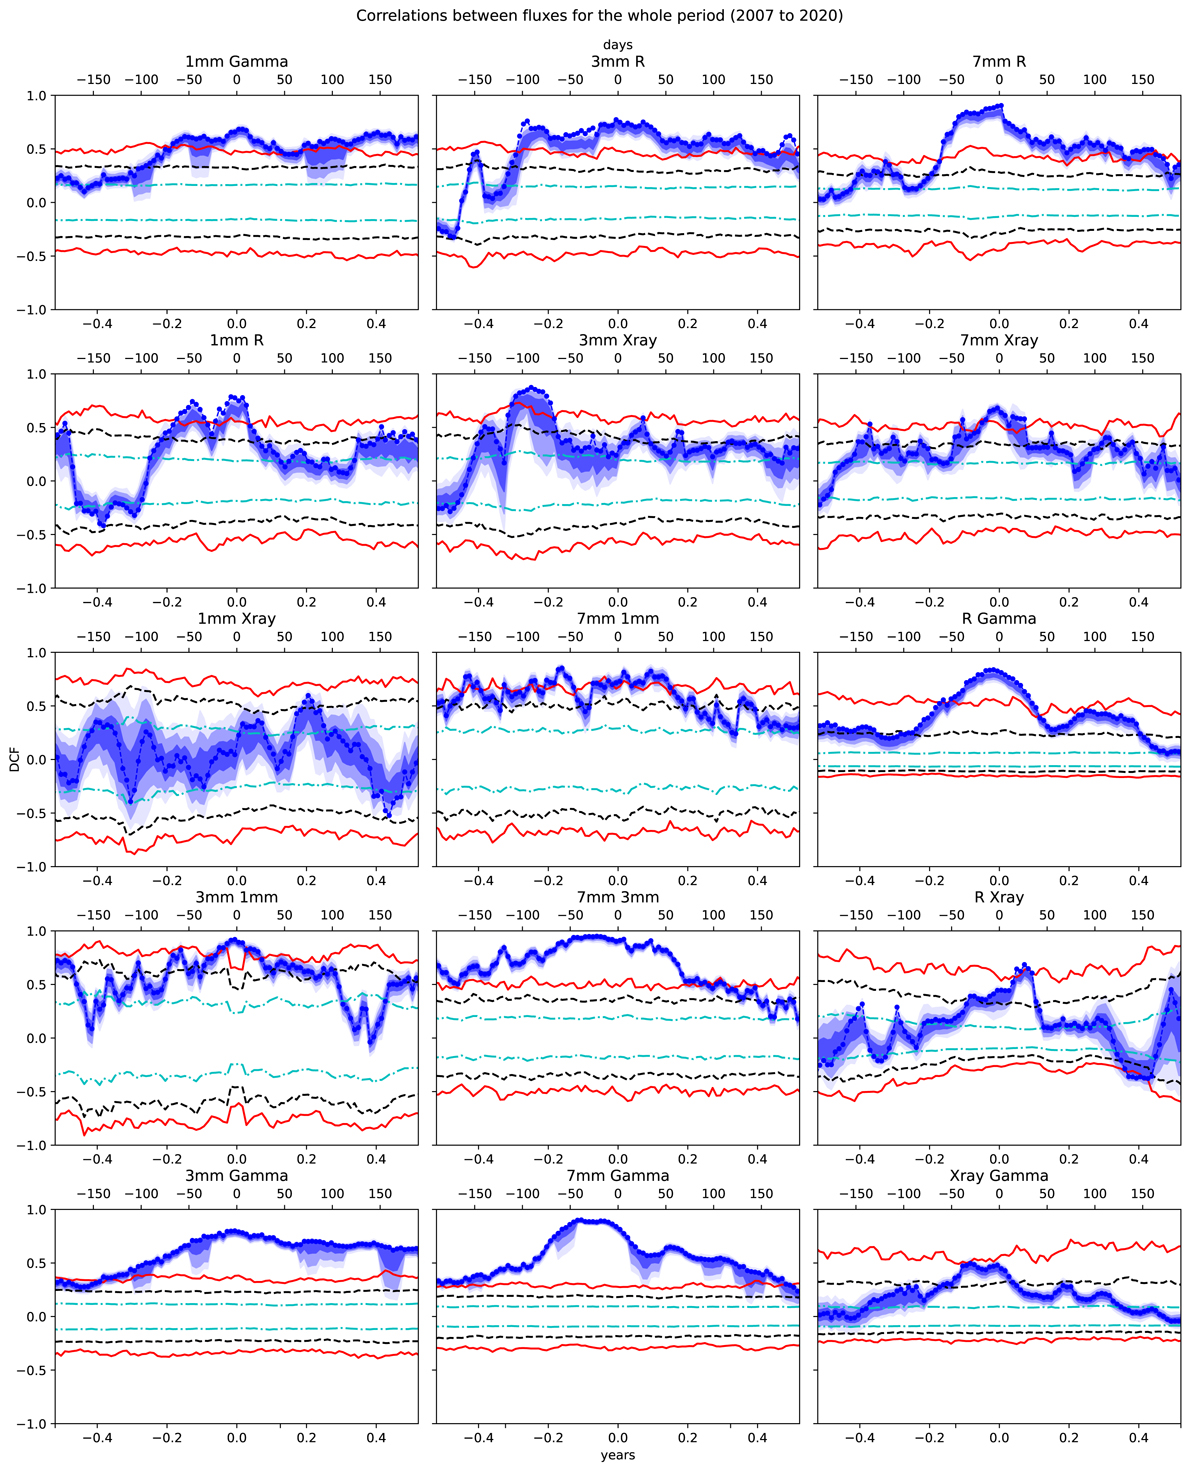
Download original image
Correlations between fluxes across all wavelengths. Horizontal lines show significance levels for 1σ, 2σ, and 3σ, computed using N = 2000 synthetic light curves, as described in Sect. 4.2. The DCFs here are computed using the whole period of available data, from 2007 to 2020.
Current usage metrics show cumulative count of Article Views (full-text article views including HTML views, PDF and ePub downloads, according to the available data) and Abstracts Views on Vision4Press platform.
Data correspond to usage on the plateform after 2015. The current usage metrics is available 48-96 hours after online publication and is updated daily on week days.
Initial download of the metrics may take a while.