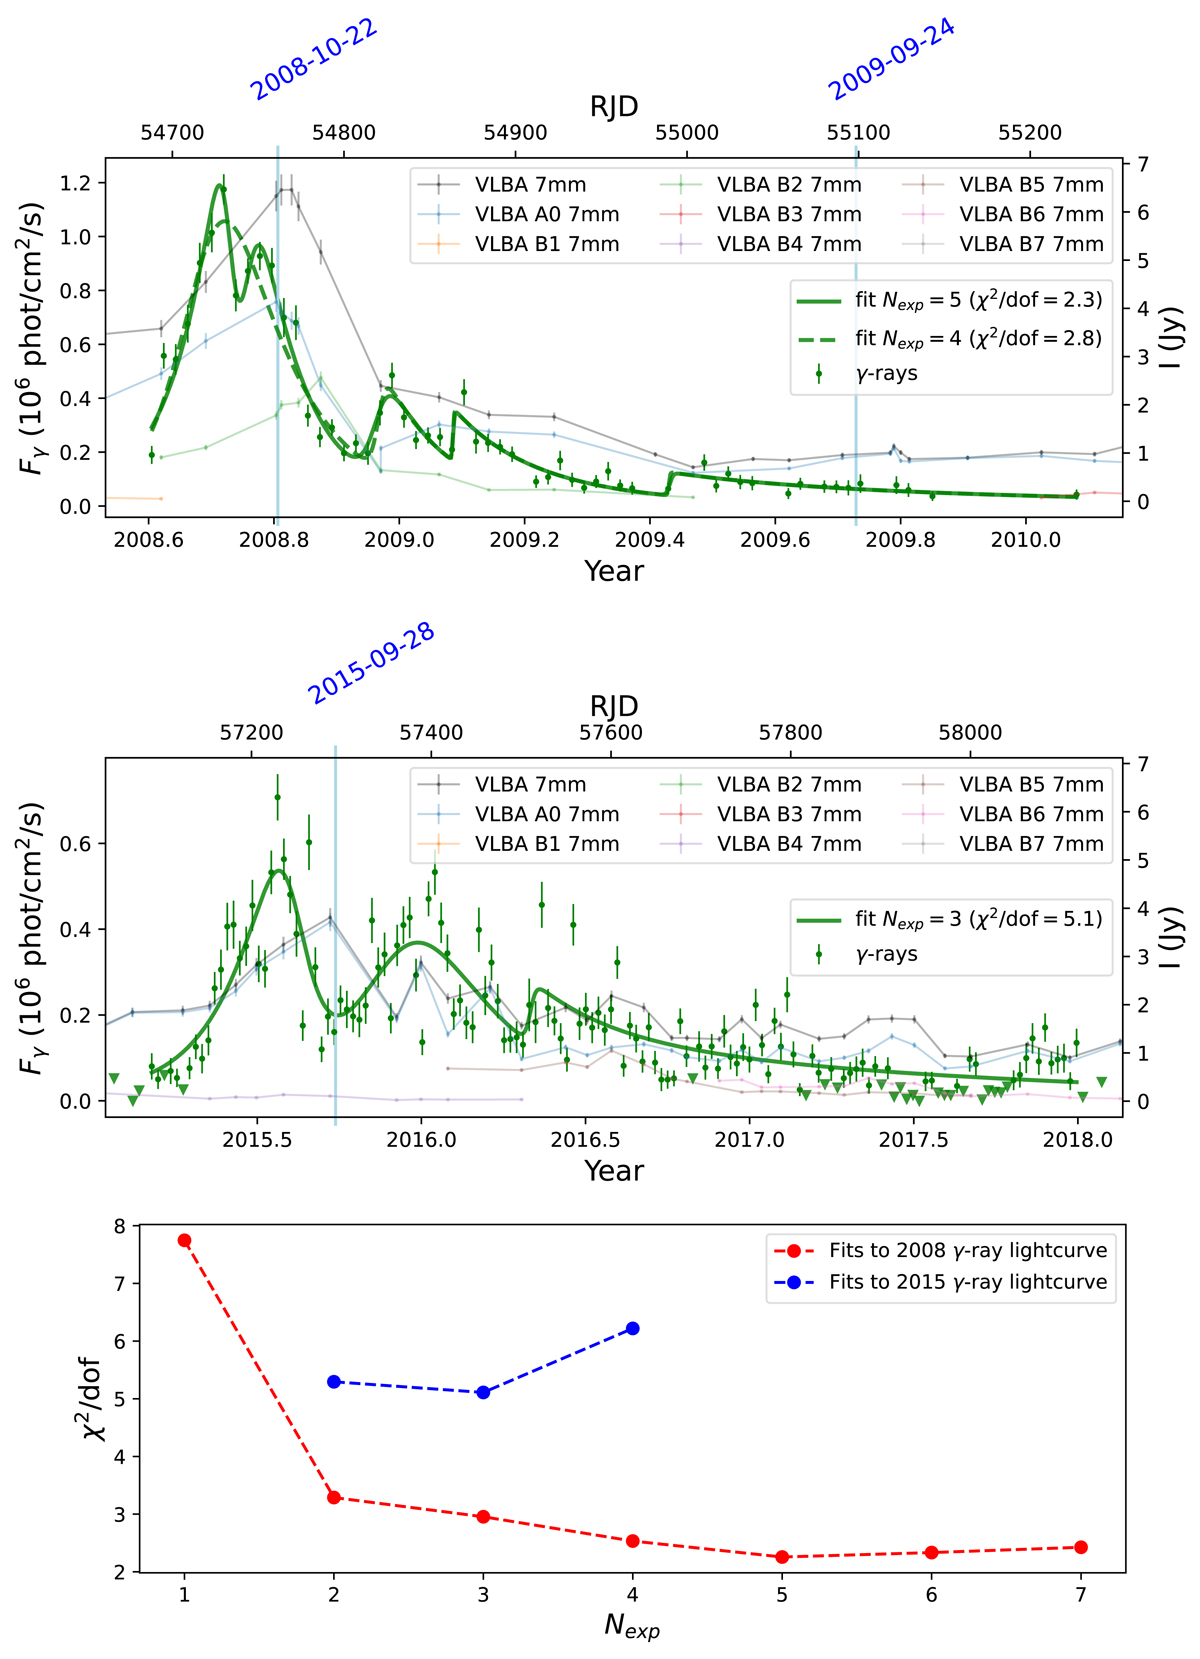
Fig. 7.
Download original image
Fits to the profiles of the 2008 (top) and the 2005 (middle) γ-ray flares by exponential functions as described by Eq. (1). The selected number of terms Nexp were chosen so that the reduced χ2-statistic was minimized (bottom). The best-fit values are given in Tables 1 and 2. An alternative fit is given for the 2008 flare with a similar χ2, that accounts for the double peak at the beginning with a single exponential term. The vertical lines mark the epochs whose SED was analyzed in Sect. 4.4, as in Fig. 1.
Current usage metrics show cumulative count of Article Views (full-text article views including HTML views, PDF and ePub downloads, according to the available data) and Abstracts Views on Vision4Press platform.
Data correspond to usage on the plateform after 2015. The current usage metrics is available 48-96 hours after online publication and is updated daily on week days.
Initial download of the metrics may take a while.