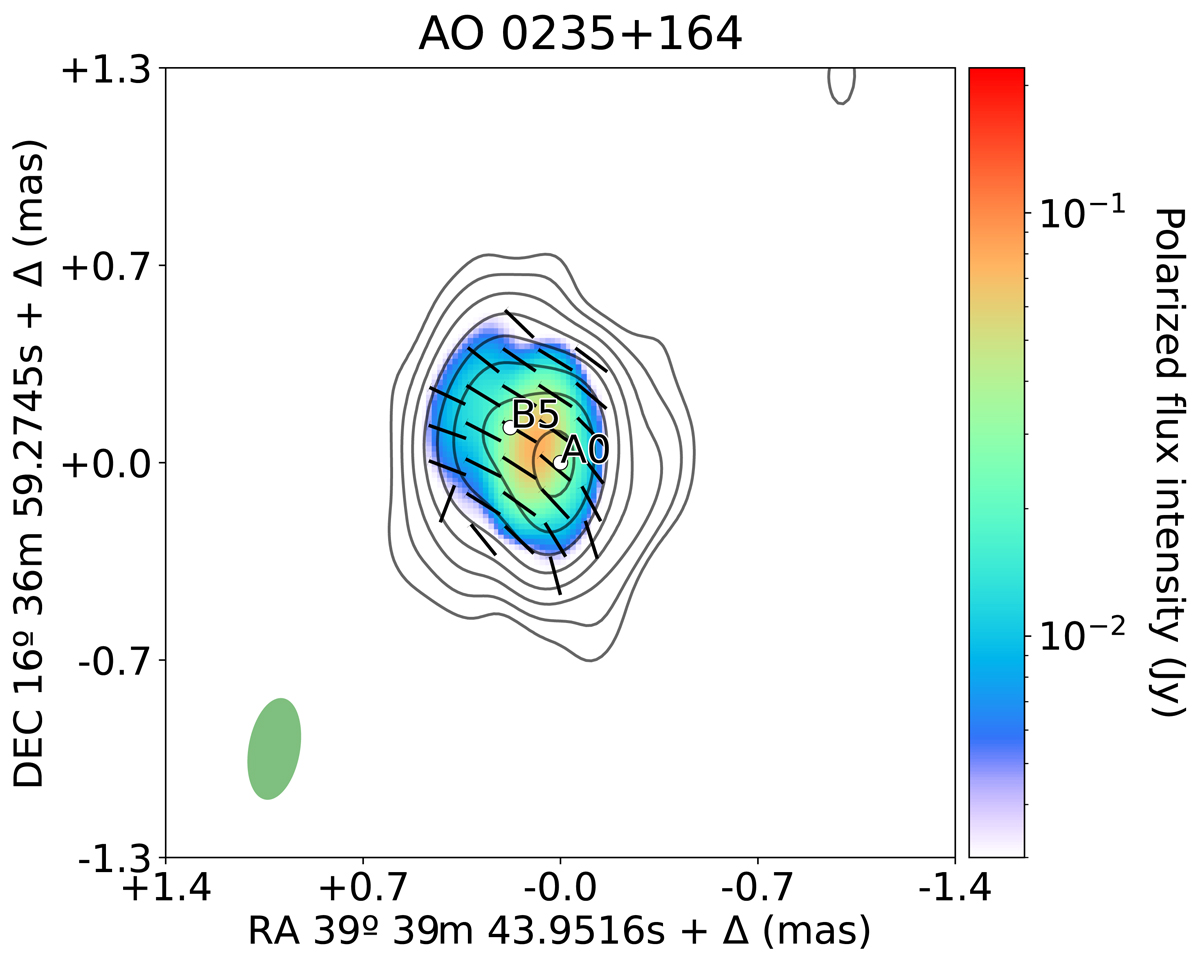
Fig. 5.
Download original image
Epoch 102 (2016-09-05) VLBI 7 mm image, showing total flux intensity (contours) and polarized flux intensity (color scale). Black line segments overlaid in the image represent the EVPA. The green ellipse in the lower left corner represents the beam size. The image showcases component B5 close to the peak of the 2015 flaring episode, demonstrating how the polarization angle is aligned with the direction of propagation.
Current usage metrics show cumulative count of Article Views (full-text article views including HTML views, PDF and ePub downloads, according to the available data) and Abstracts Views on Vision4Press platform.
Data correspond to usage on the plateform after 2015. The current usage metrics is available 48-96 hours after online publication and is updated daily on week days.
Initial download of the metrics may take a while.