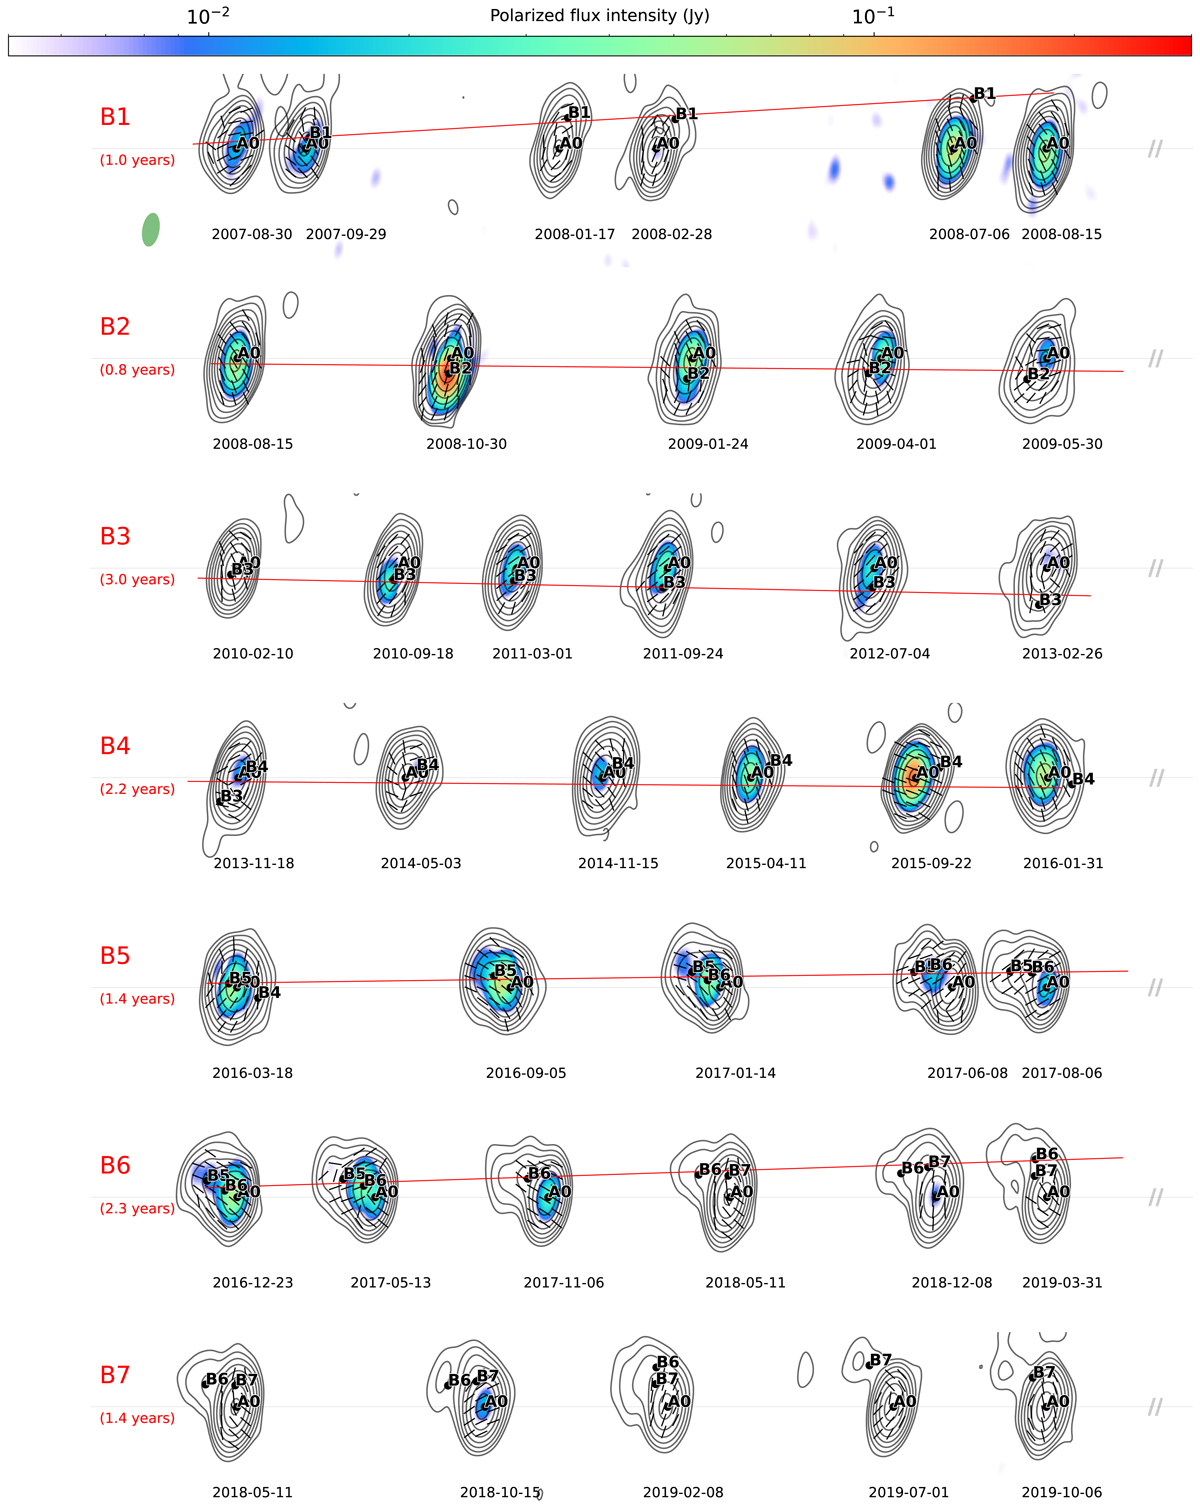
Fig. 4.
Download original image
Selected epochs illustrating the evolution of each identified knot, showing total (contours) and polarized (color scale) intensity. The beam size is indicated as a green ellipse in the first row. Horizontal black lines indicate the position of the core A0, black line segments within the image indicate the direction of polarization (EVPA). The red line in each row is the linear fit to the knot position. It is present for every knot except B7, whose flux was too low to accurately perform a fit. For each row, the spacing between plots is proportional to time, and the total time span is different and indicated in brackets.
Current usage metrics show cumulative count of Article Views (full-text article views including HTML views, PDF and ePub downloads, according to the available data) and Abstracts Views on Vision4Press platform.
Data correspond to usage on the plateform after 2015. The current usage metrics is available 48-96 hours after online publication and is updated daily on week days.
Initial download of the metrics may take a while.