Fig. 6.
Download original image
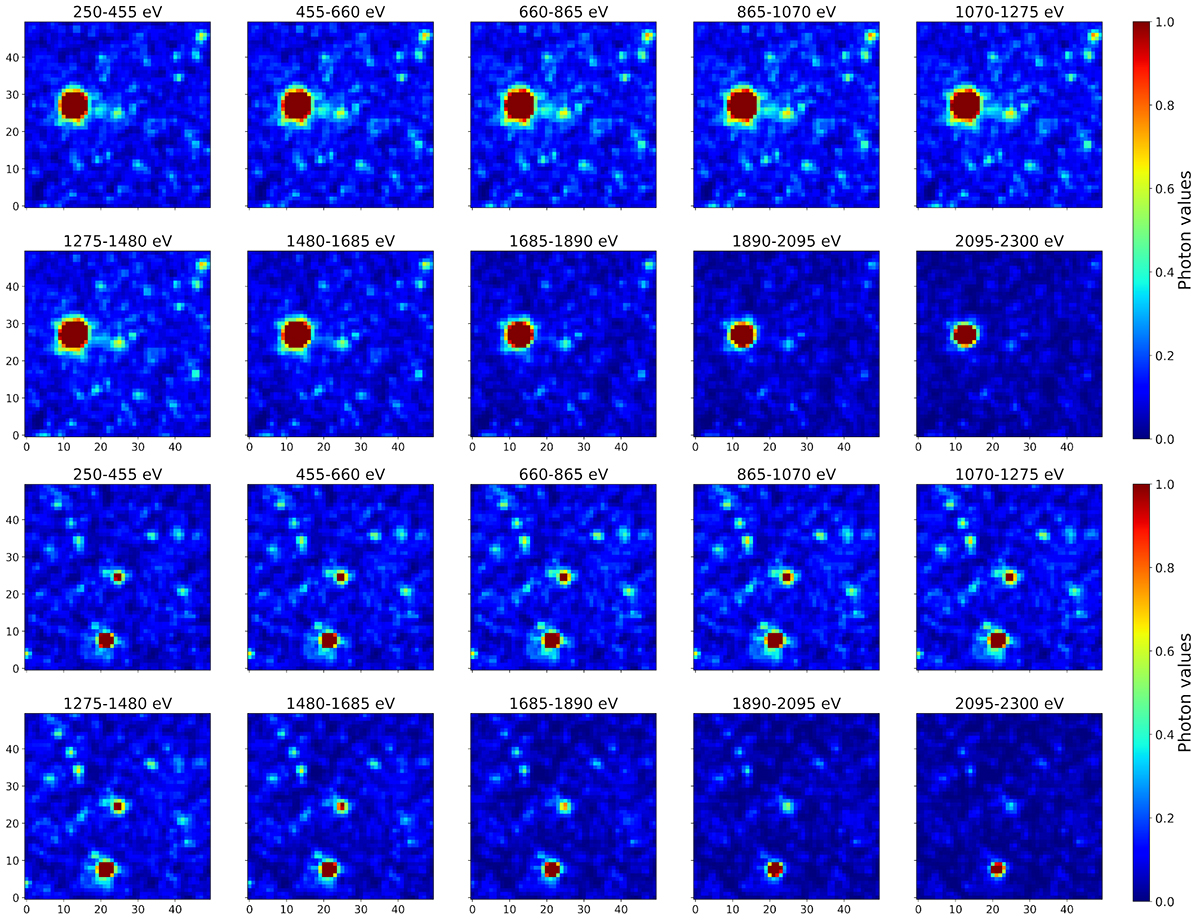
All ten channels of the EBI of the galaxy cluster with the highest and lowest Δμ = μmax − μmin, where μmax (μmin) corresponds to the highest (smallest) predicted mass by the ensemble members. Top: this cluster, located as usual at the center of the EBI, has a mass of log M500/M⊙ = 13.959 and is at redshift z = 0.211 in the simulations (Object with SRC_ID: 10003763 from realization 18). The lowest and highest predicted mean values in our ensemble are μmin = 13.323 and μmax = 14.587, respectively. For illustration purposes, to make the actual cluster visible, we have clipped the photon values at 1. The final mass predictions are log M500/M⊙ = 14.079 ± 0.305. Bottom: example of a cluster with little differences among the ensemble (SRC_ID: 10006556 from realization 9), it has a mass of log M500/M⊙ = 13.873 and is at redshift z = 0.305. We obtain μmax = 14.095 and μmin = 13.994 and our final prediction for this cluster is log M500/M⊙ = 14.042 ± 0.161.
Current usage metrics show cumulative count of Article Views (full-text article views including HTML views, PDF and ePub downloads, according to the available data) and Abstracts Views on Vision4Press platform.
Data correspond to usage on the plateform after 2015. The current usage metrics is available 48-96 hours after online publication and is updated daily on week days.
Initial download of the metrics may take a while.