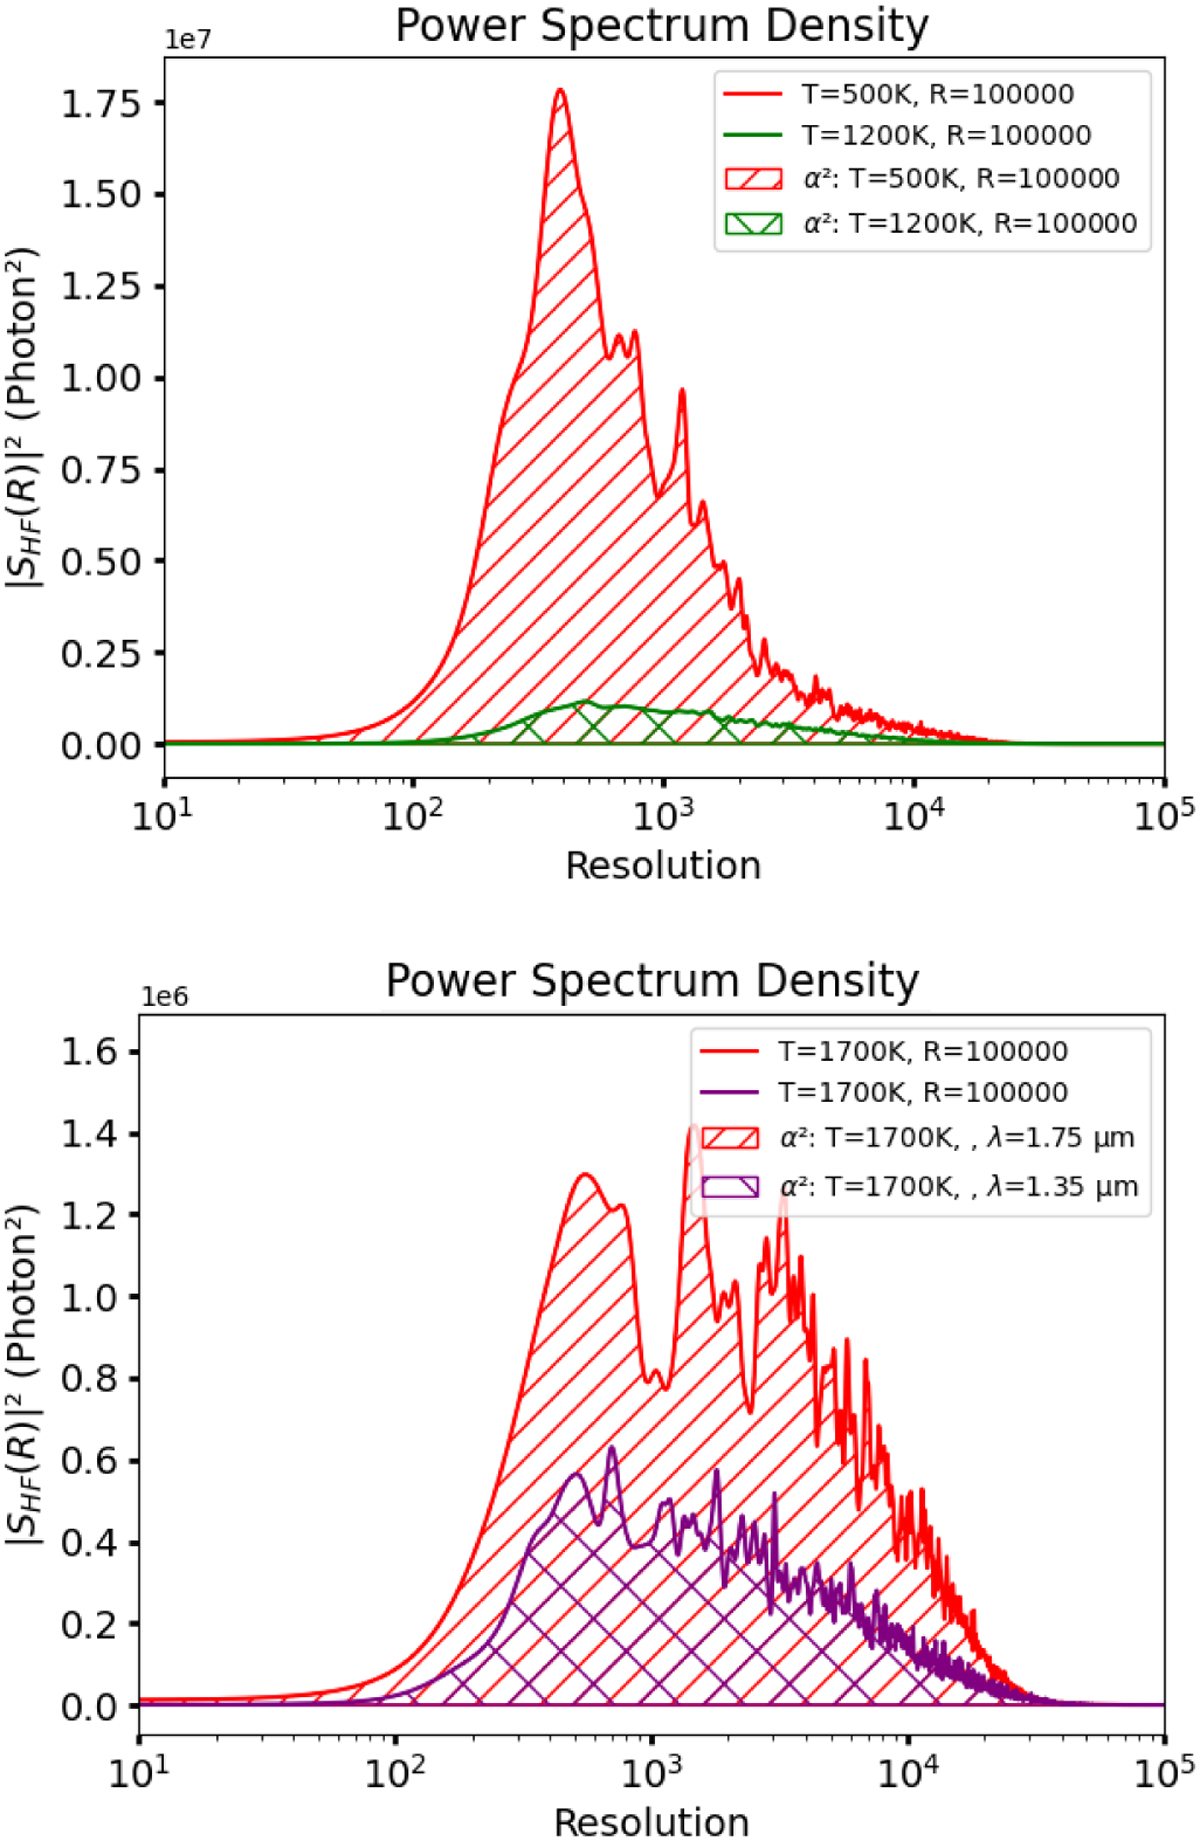
Fig. C.1
Download original image
Visualization of the amount of information useful for molecular mapping detection. Top panel: PSD of two high-pass filtered planet spectra (T=500K and T=1200K, log(g)=4, [M/H]=0) at the same resolutions and with the same amount of photons. Bottom panel: PSD of high-pass filtered planet spectra (T=1700K, log(g)=4, [M/H]=0) on two different spectral ranges with a 300 nm bandwidth (center on λ0 = 1.35 µm in red and center on λ0 = 1.75 µm in purple).
Current usage metrics show cumulative count of Article Views (full-text article views including HTML views, PDF and ePub downloads, according to the available data) and Abstracts Views on Vision4Press platform.
Data correspond to usage on the plateform after 2015. The current usage metrics is available 48-96 hours after online publication and is updated daily on week days.
Initial download of the metrics may take a while.