Fig. 2
Download original image
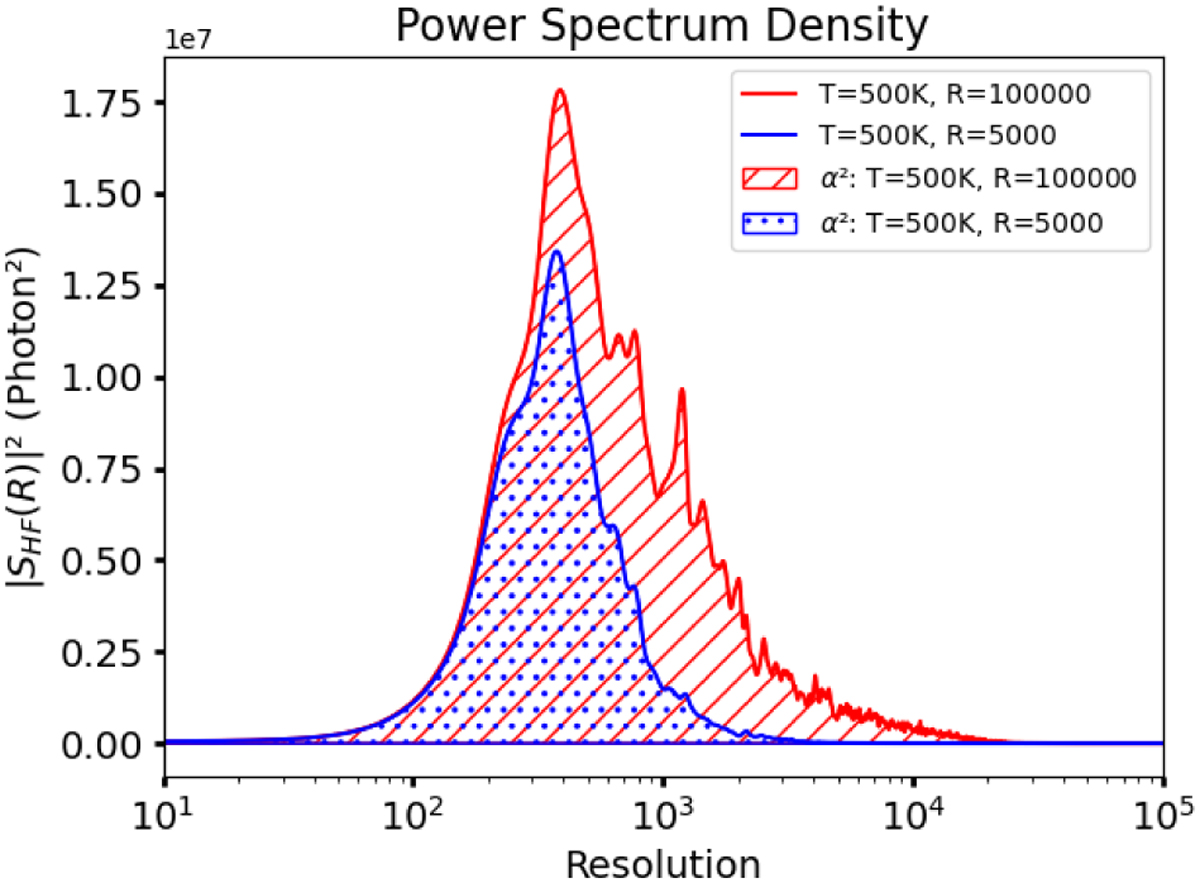
PSD of high-pass filtered (Rc = 100) planet spectrum (T = 500 K, log(g) = 4, [M/H] = 0) for two different resolutions on the total spectral range offered by BT-Settl spectra (0.3–12 µm). The hatched areas correspond to the areas under the curves equal to the quantity α2. Note: the PSD has been smoothed only for better visualization purposes. The y-axis is relative to the total flux of the companions. Only the ratios between the curves explaining the a variation from a given resolution to another one should be taken into consideration.
Current usage metrics show cumulative count of Article Views (full-text article views including HTML views, PDF and ePub downloads, according to the available data) and Abstracts Views on Vision4Press platform.
Data correspond to usage on the plateform after 2015. The current usage metrics is available 48-96 hours after online publication and is updated daily on week days.
Initial download of the metrics may take a while.