Fig. 13

Download original image
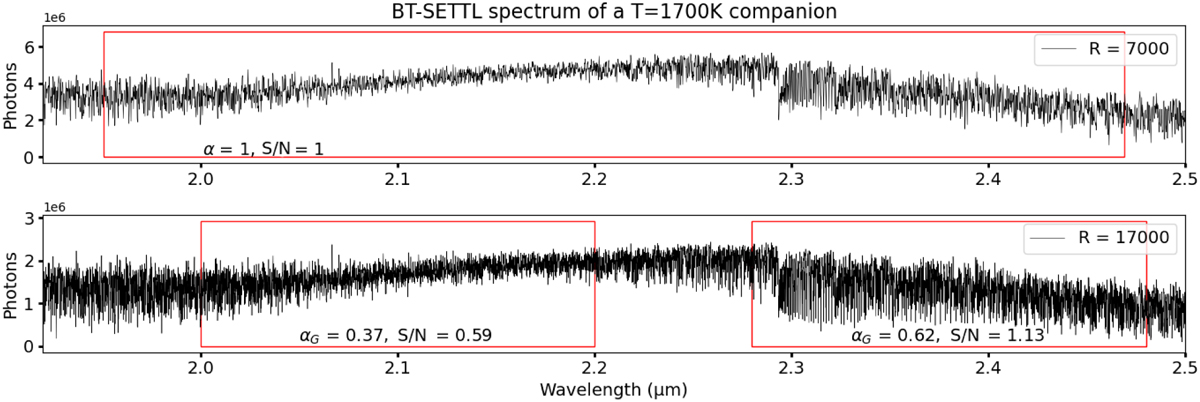
BT-Settl spectrum of a T = 1700 K companion at two different spectral resolutions: R = 7000 (top) and R = 17 000 (bottom). Each red rectangle delimits the observable spectral bands by keeping the same number of pixels for both resolutions. In each case, the corresponding α quantities and the S/N, both normalized to the top panel, are indicated. We note that some areas have more absorption lines, and thus benefit more than others from an increased resolution (e.g., there is a forest of lines corresponding to the presence of CO around 2.3 µm). Both α and the photon noise decrease as the resolution increases and the bandwidth decreases; comparing the two variations may lead to a lower (left rectangle) or higher (right rectangle) resulting S/N.
Current usage metrics show cumulative count of Article Views (full-text article views including HTML views, PDF and ePub downloads, according to the available data) and Abstracts Views on Vision4Press platform.
Data correspond to usage on the plateform after 2015. The current usage metrics is available 48-96 hours after online publication and is updated daily on week days.
Initial download of the metrics may take a while.


