Fig. 11
Download original image
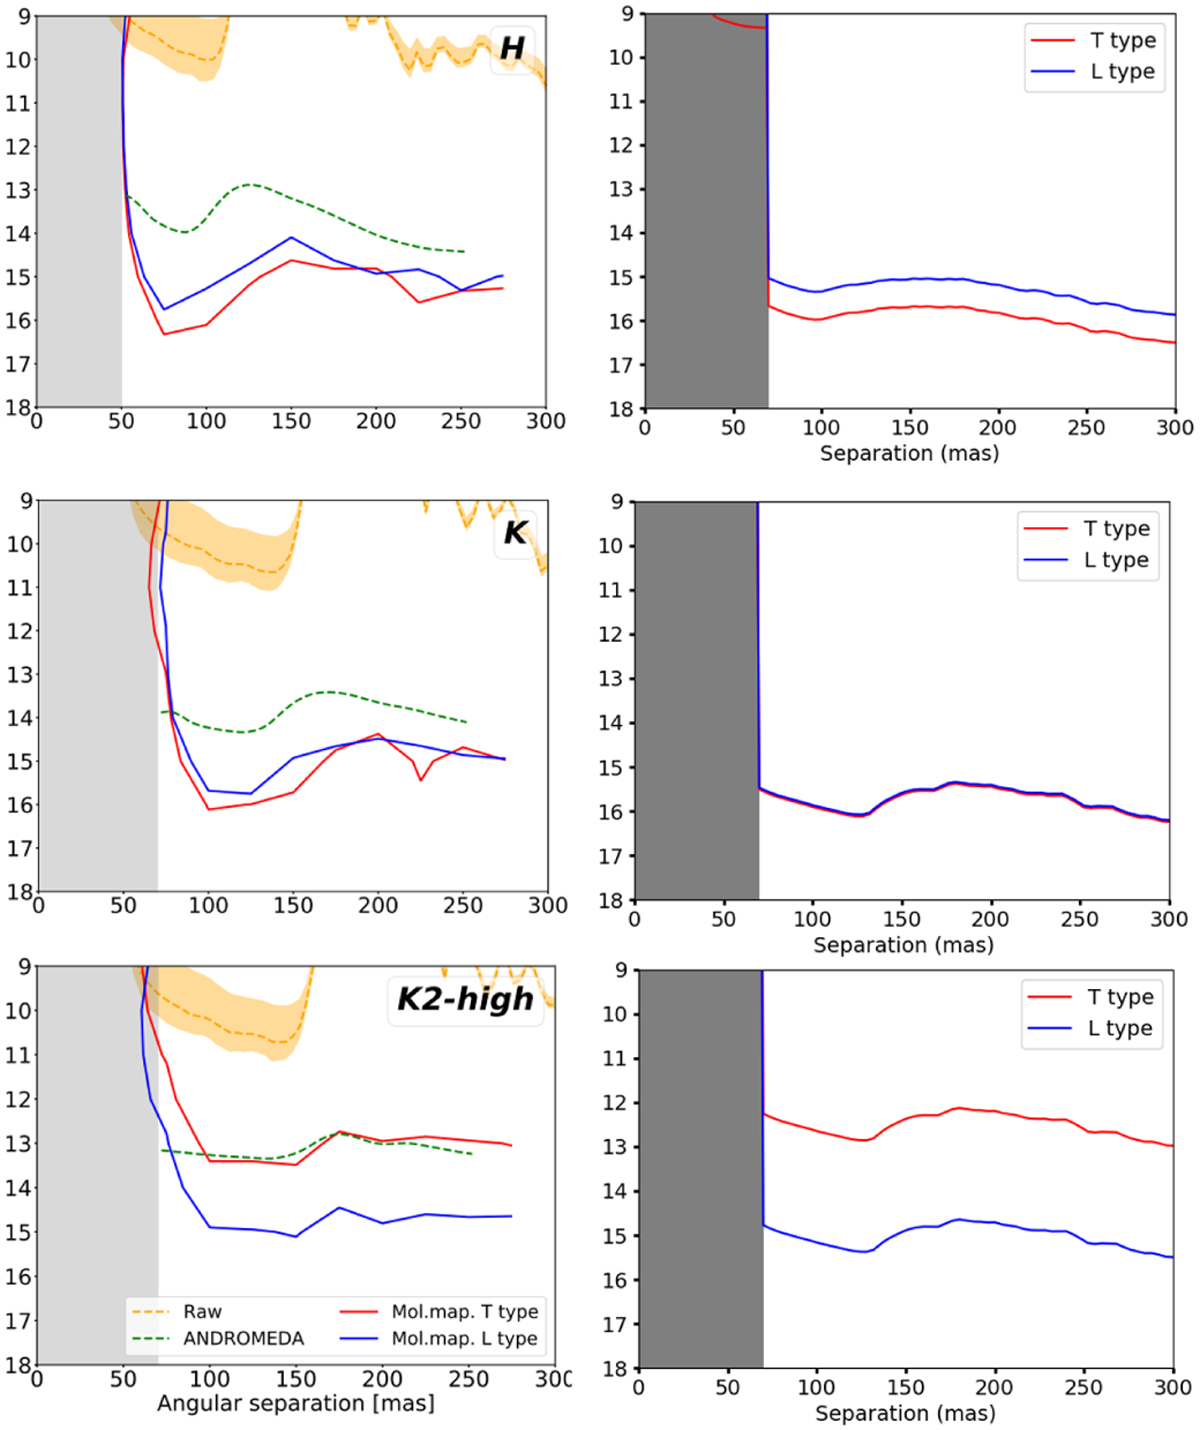
Comparison between our approach (right column) and results from Houllé et al. (left column). The comparison was made for the H, K, and K2 high bands observation modes (see Table 1) with a star magnitude of 4.7, L, and T spectral type companions, as well as a rotational broadening of 20 km s−1. These curves are simulated with median seeing conditions with a Strehl ratio of about 80% in K band. The total exposure time is set to 2 h. We note that the green dashed curve on the left panel is the contrast curve obtained with the ADI ANDROMEDA algorithm (Cantalloube et al. 2015), and the orange curve is the raw contrast with a standard deviation of 1σ.
Current usage metrics show cumulative count of Article Views (full-text article views including HTML views, PDF and ePub downloads, according to the available data) and Abstracts Views on Vision4Press platform.
Data correspond to usage on the plateform after 2015. The current usage metrics is available 48-96 hours after online publication and is updated daily on week days.
Initial download of the metrics may take a while.