Fig. 10
Download original image
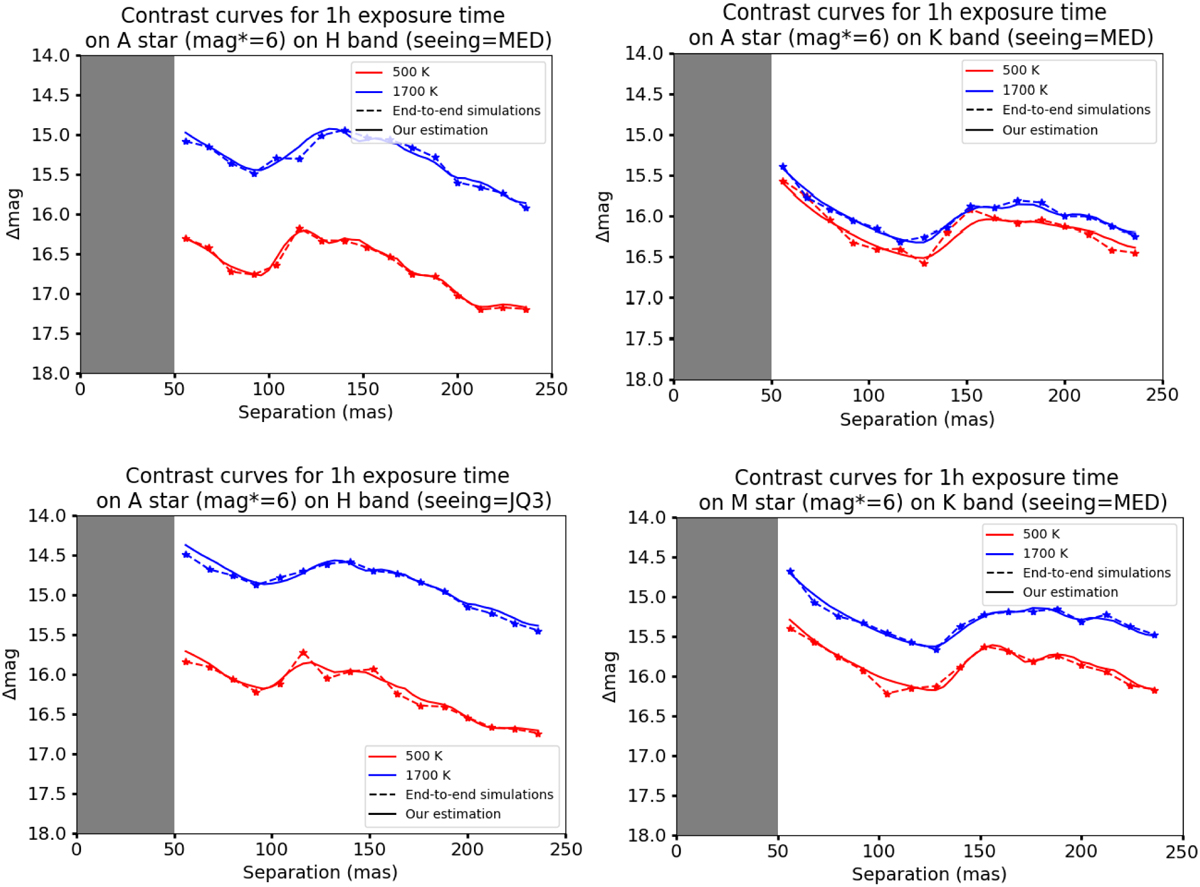
Comparison of contrast curves obtained through our method with respect to end-to-end simulations. The comparison has been made for 1 h exposures with respect to several cases: (top left panel) H-band HARMONI observation mode (Table 1) with an A-star (7200 K, log(g) = 4, [M/H] = 0) magnitude of 6 with T-type planet (500 K, log(g) = 4, [M/H] = 0) and L-type planet (1700 K, log(g) = 4, [M/H] = 0) with median seeing condition (0.65″ for λ = 0.5 µm, Strehl = 94%). Top-right panel: same templates and conditions on K-band HARMONI observation mode. Bottom-right panel: same templates on H-band with JQ3 seeing condition (0.74″ for λ = 0.5 µm, Strehl = 73%). Bottom-left panel: same planetary templates but with an M-star (3200 K, log(g) = 4, [M/H] = 0) on K-band with median seeing condition. The solid lines are the prediction of FastCurves with these parameters, the dashed lines are the result of molecular mapping processing with time-series simulated PSF and fake planets injection.
Current usage metrics show cumulative count of Article Views (full-text article views including HTML views, PDF and ePub downloads, according to the available data) and Abstracts Views on Vision4Press platform.
Data correspond to usage on the plateform after 2015. The current usage metrics is available 48-96 hours after online publication and is updated daily on week days.
Initial download of the metrics may take a while.