Fig. 9.
Download original image
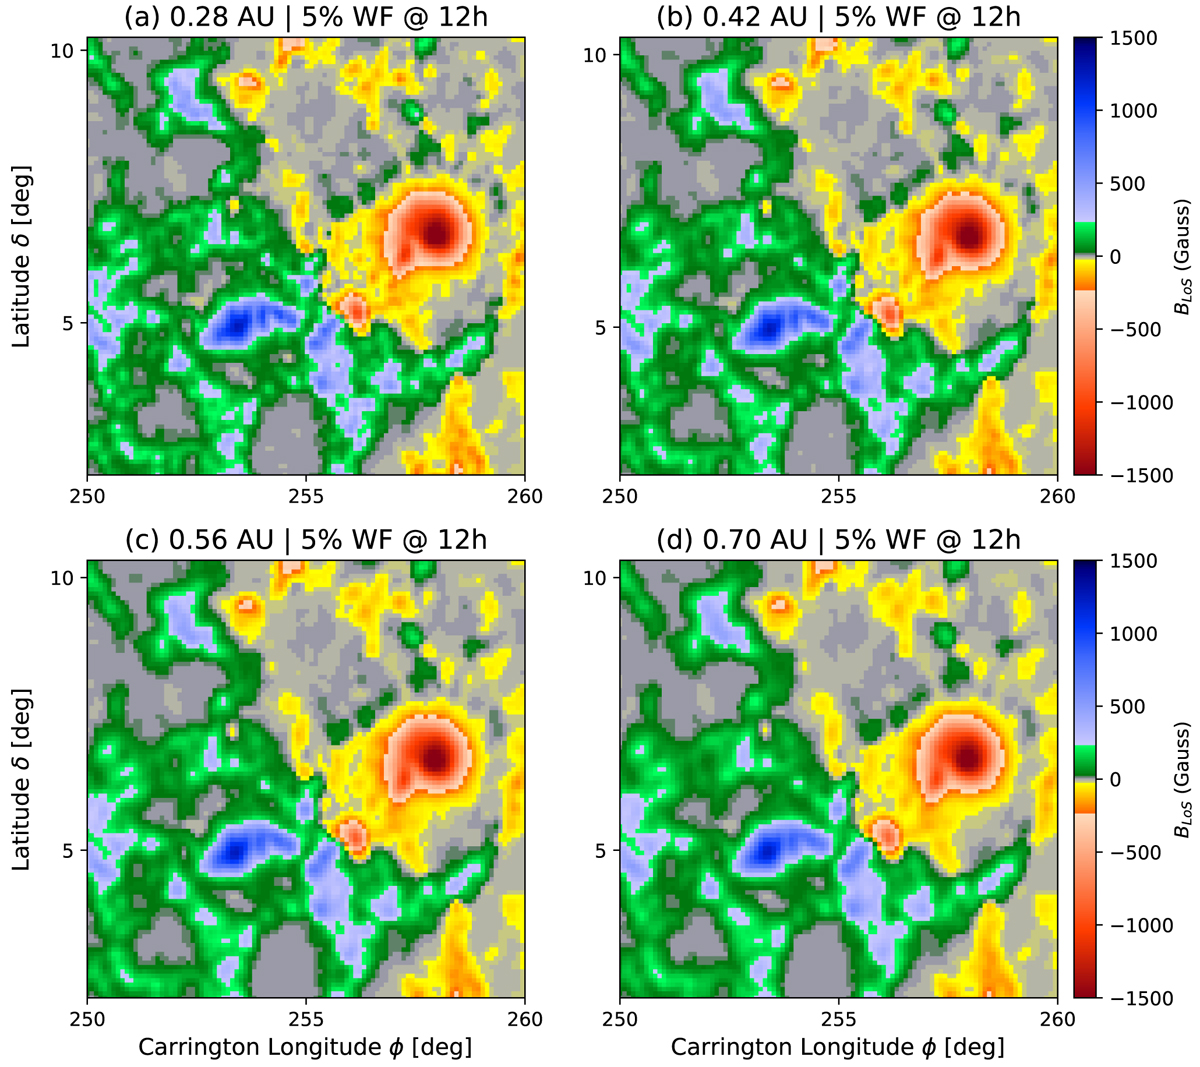
Synoptic maps for the test region in CR 2150 as they would be observed from various distances. Panel a shows the synoptic map as would be observed from (a) 0.28 au, (b) 0.42 au, (c) 0.56 au, and (d) 0.70 au orbital distance. All four cases are constructed from observations at 12 h cadence and were processed with a narrow weight function of 5% residual contribution.
Current usage metrics show cumulative count of Article Views (full-text article views including HTML views, PDF and ePub downloads, according to the available data) and Abstracts Views on Vision4Press platform.
Data correspond to usage on the plateform after 2015. The current usage metrics is available 48-96 hours after online publication and is updated daily on week days.
Initial download of the metrics may take a while.