Fig. 7.
Download original image
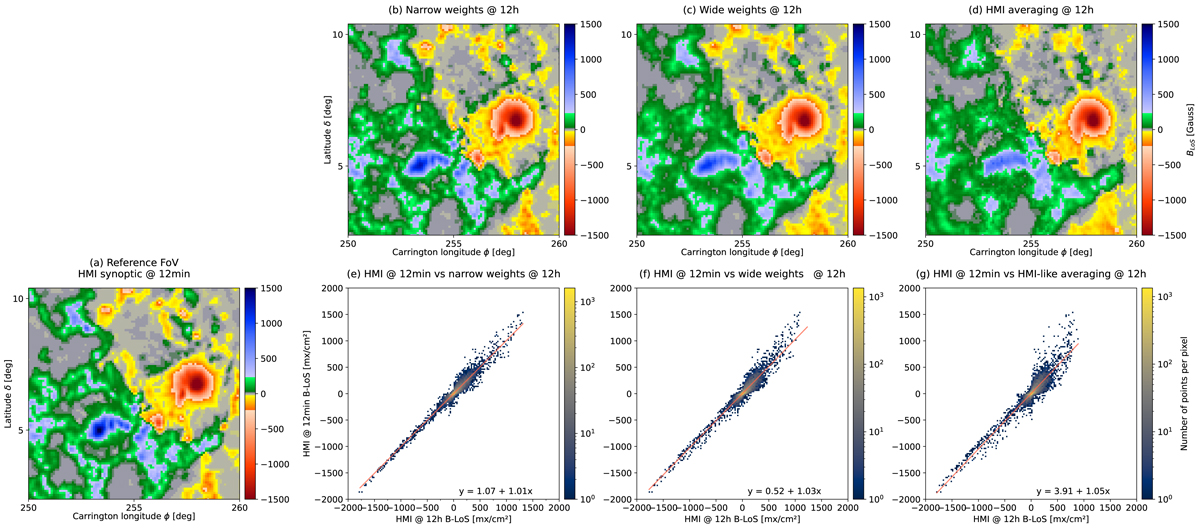
Test region from CR 2150 observed for different cadences and averaging methods. (a) Reference case standard SDO/HMI synoptic map at 12 minute cadence. Each Carrington coordinate is averaged from the 20 closest ‘HMI.M_720s’ magnetograms within a 30° window. (b) Updated synoptic map pipeline, which incorporates a narrow weight function with 5% contribution at the central meridian of the adjacent magnetogram slice. (c) Same as (b) but a wider weight function with 55% contribution at the central meridian of the adjacent magnetogram slice. (d) Same as panel a but at a reduced cadence of 12 h. Panels e–g show a comparison of the magnetic field distribution between the reference synoptic map in (a) and the adjacent low cadence and the low-cadence variants in (b), (c), and (d). The resulting linear fit equation is provided in each panel.
Current usage metrics show cumulative count of Article Views (full-text article views including HTML views, PDF and ePub downloads, according to the available data) and Abstracts Views on Vision4Press platform.
Data correspond to usage on the plateform after 2015. The current usage metrics is available 48-96 hours after online publication and is updated daily on week days.
Initial download of the metrics may take a while.