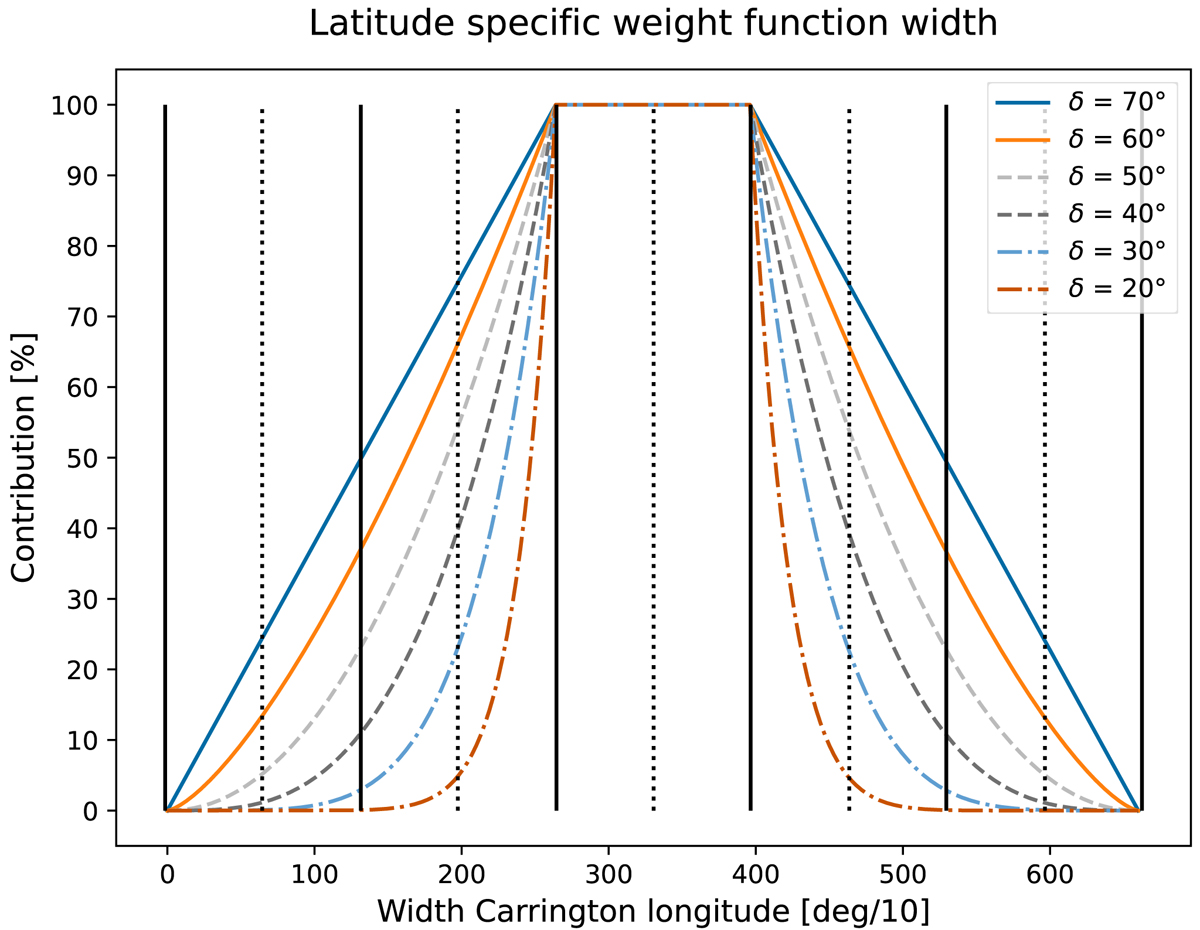
Fig. 5.
Download original image
Latitude-dependent weight functions with increasing contribution between 20° and 70° Carrington latitude (see legend). The dashed black vertical lines mark the central meridians and the solid vertical lines mark the transition between adjacent magnetograms. The weights start at 5% contribution at the adjacent meridian for 20° latitude and linearly increase to 45% contribution for 70° latitude.
Current usage metrics show cumulative count of Article Views (full-text article views including HTML views, PDF and ePub downloads, according to the available data) and Abstracts Views on Vision4Press platform.
Data correspond to usage on the plateform after 2015. The current usage metrics is available 48-96 hours after online publication and is updated daily on week days.
Initial download of the metrics may take a while.