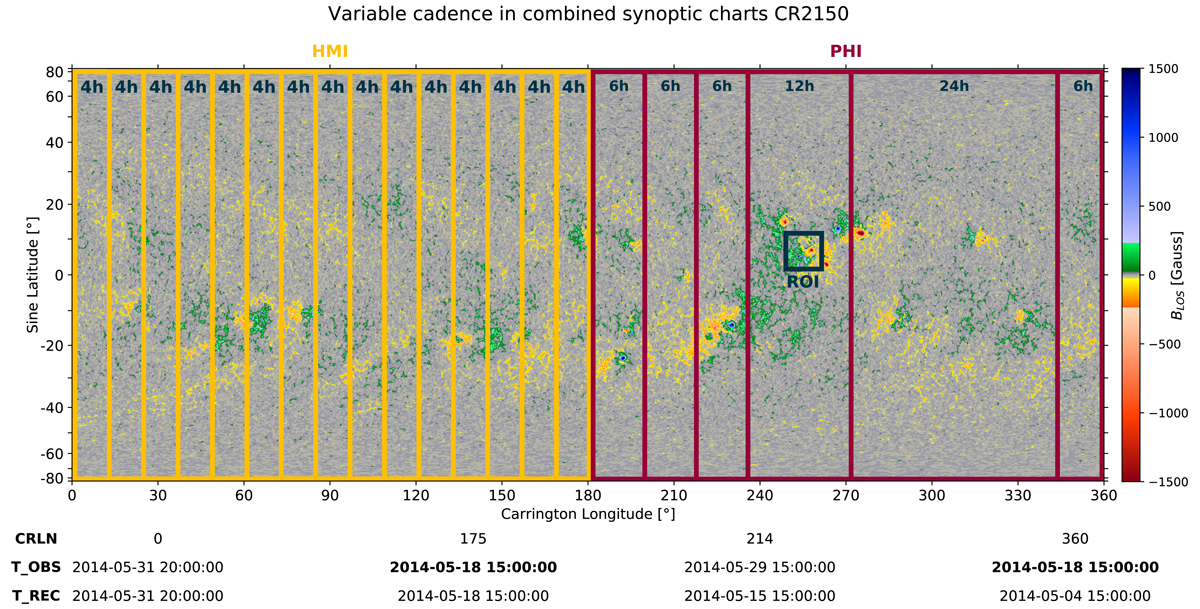
Fig. 1.
Download original image
Example of a synoptic map created with data gathered with different cadences in the SDO/HMI (left) and SO/PHI (right) portion of the map. Data on the SDO/HMI side are averaged from the 20 closest 720s magnetograms to each coordinate, effectively forming contributions with a temporal width of 4 h (yellow grid). SO/PHI observations are only available at lower cadences. For this test case, we assumed an observation every 6–24 h (red grid). The blue region of interest shows the studied region around NOAA 12056 and NOAA 12059, which is investigated more closely in Sect. 3. Please note that the temporal widths of the contributing magnetogram stripes are not to scale. This synoptic map for CR2150 was entirely computed from SDO/HMI data.
Current usage metrics show cumulative count of Article Views (full-text article views including HTML views, PDF and ePub downloads, according to the available data) and Abstracts Views on Vision4Press platform.
Data correspond to usage on the plateform after 2015. The current usage metrics is available 48-96 hours after online publication and is updated daily on week days.
Initial download of the metrics may take a while.