Open Access
Fig. 6
Download original image
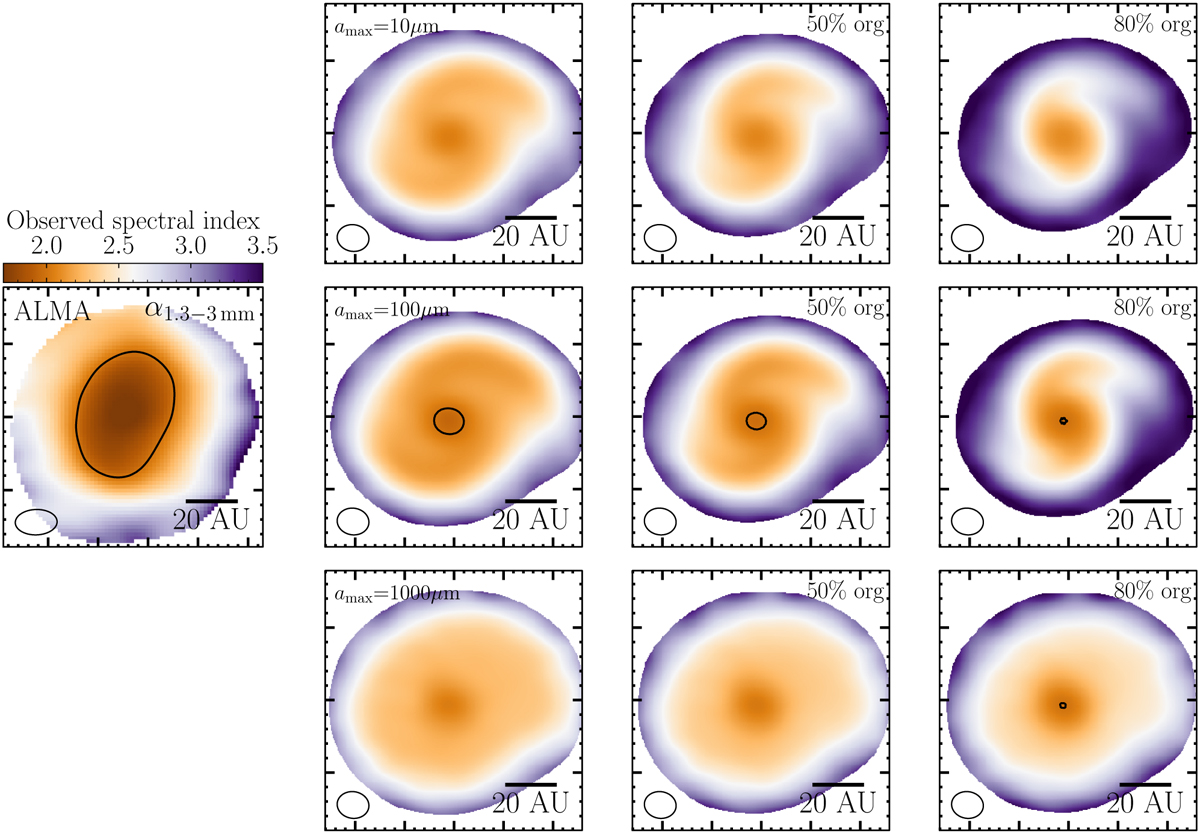
Spectral indexes for the real observation (left) and models (right). Models are shown for amax of 10 μm (top), 100 μm (center), and 1000 μm (bottom). From left to right, the columns represent the cases without sublimation and with 50% and 80% of carbon sublimation, respectively. The black contour indicates α = 2.
Current usage metrics show cumulative count of Article Views (full-text article views including HTML views, PDF and ePub downloads, according to the available data) and Abstracts Views on Vision4Press platform.
Data correspond to usage on the plateform after 2015. The current usage metrics is available 48-96 hours after online publication and is updated daily on week days.
Initial download of the metrics may take a while.