Open Access
Fig. 3.
Download original image
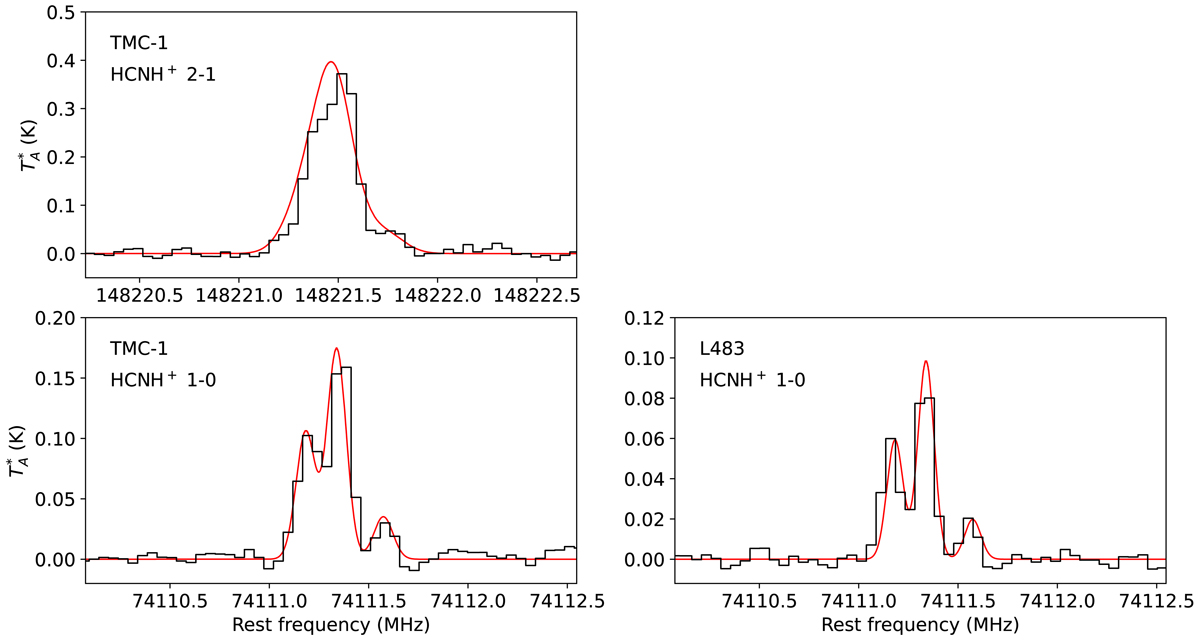
Lines of HCNH+ in TMC-1 (j1 = 1 → 0 and j1 = 2 → 1 in the left panels) and L483 (j1 = 1 → 0 in the right panel). Black histograms correspond to the observed line profiles, while the red lines correspond to the synthetic line profile calculated with the LVG model (see text).
Current usage metrics show cumulative count of Article Views (full-text article views including HTML views, PDF and ePub downloads, according to the available data) and Abstracts Views on Vision4Press platform.
Data correspond to usage on the plateform after 2015. The current usage metrics is available 48-96 hours after online publication and is updated daily on week days.
Initial download of the metrics may take a while.