Fig. 3.
Download original image
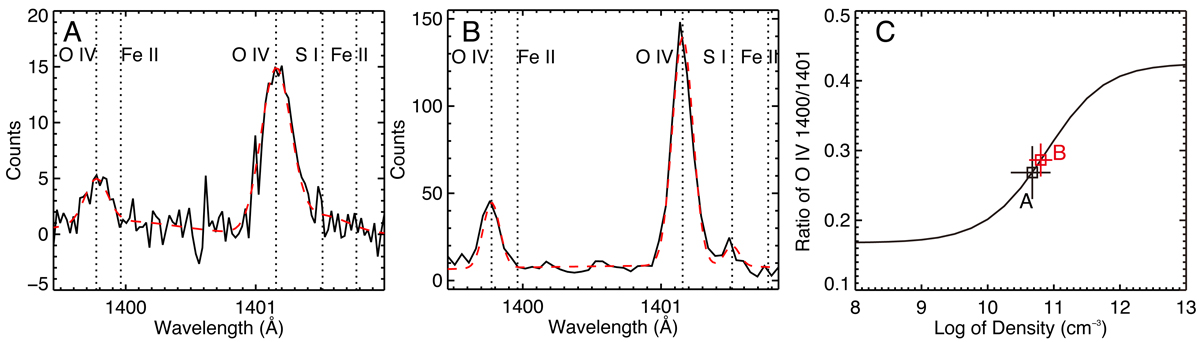
Density diagnosis for events 1 and 5. (A) and (B) IRIS spectral profiles (black lines), including the O IV 1400/1401 doublet lines used for the density diagnosis. Panel (A) corresponds to event 1 shown in Figs. 1A–D, while (B) corresponds to event 5 shown in Figs. 1E–H. The red dashed lines are the multi-Gaussian fitting result. (C) Theoretically predicted curve associating the O IV intensity ratio with the electron number density. The small black and red squares represent the intensity ratios obtained from (A) and (B), respectively, as well as their corresponding densities. The error bars are also added.
Current usage metrics show cumulative count of Article Views (full-text article views including HTML views, PDF and ePub downloads, according to the available data) and Abstracts Views on Vision4Press platform.
Data correspond to usage on the plateform after 2015. The current usage metrics is available 48-96 hours after online publication and is updated daily on week days.
Initial download of the metrics may take a while.