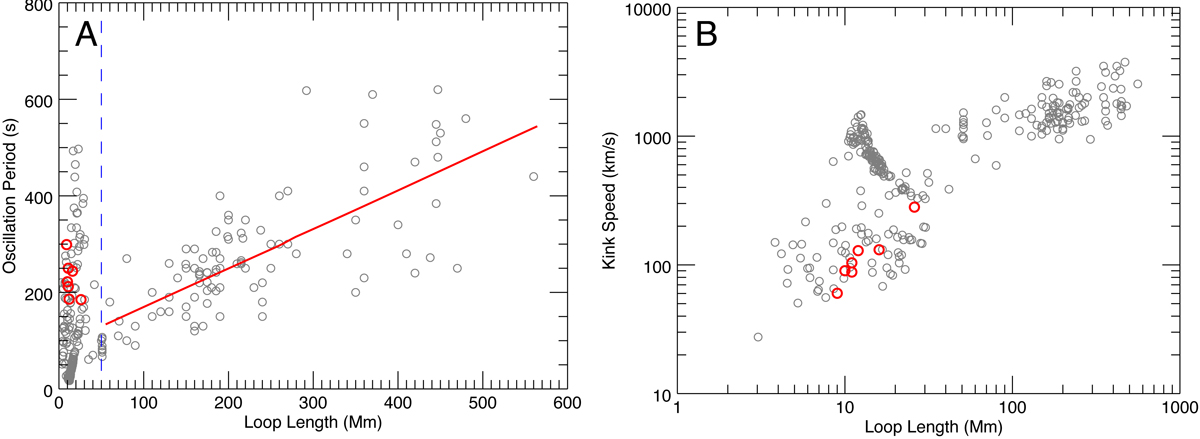
Fig. 2.
Download original image
Relationship between different oscillation parameters. (A) Scatter plot between the oscillation period and loop length for the oscillation events in our study (marked by red circles) and previous literature (Anfinogentov et al. 2013, 2015; Duckenfield et al. 2018; Zhong et al. 2022; Gao et al. 2022; Li & Long 2023; Mandal et al. 2022; Petrova et al. 2023; Shrivastav et al. 2023, marked by grey circles). The blue dashed line corresponds to a loop length of 50 Mm; the scatter points to its right are linearly fitted, with the best fit shown with the red solid line. (B) Scatter plot between the kink speed and loop length for the same data set, presented in log-log space for better visualisation.
Current usage metrics show cumulative count of Article Views (full-text article views including HTML views, PDF and ePub downloads, according to the available data) and Abstracts Views on Vision4Press platform.
Data correspond to usage on the plateform after 2015. The current usage metrics is available 48-96 hours after online publication and is updated daily on week days.
Initial download of the metrics may take a while.