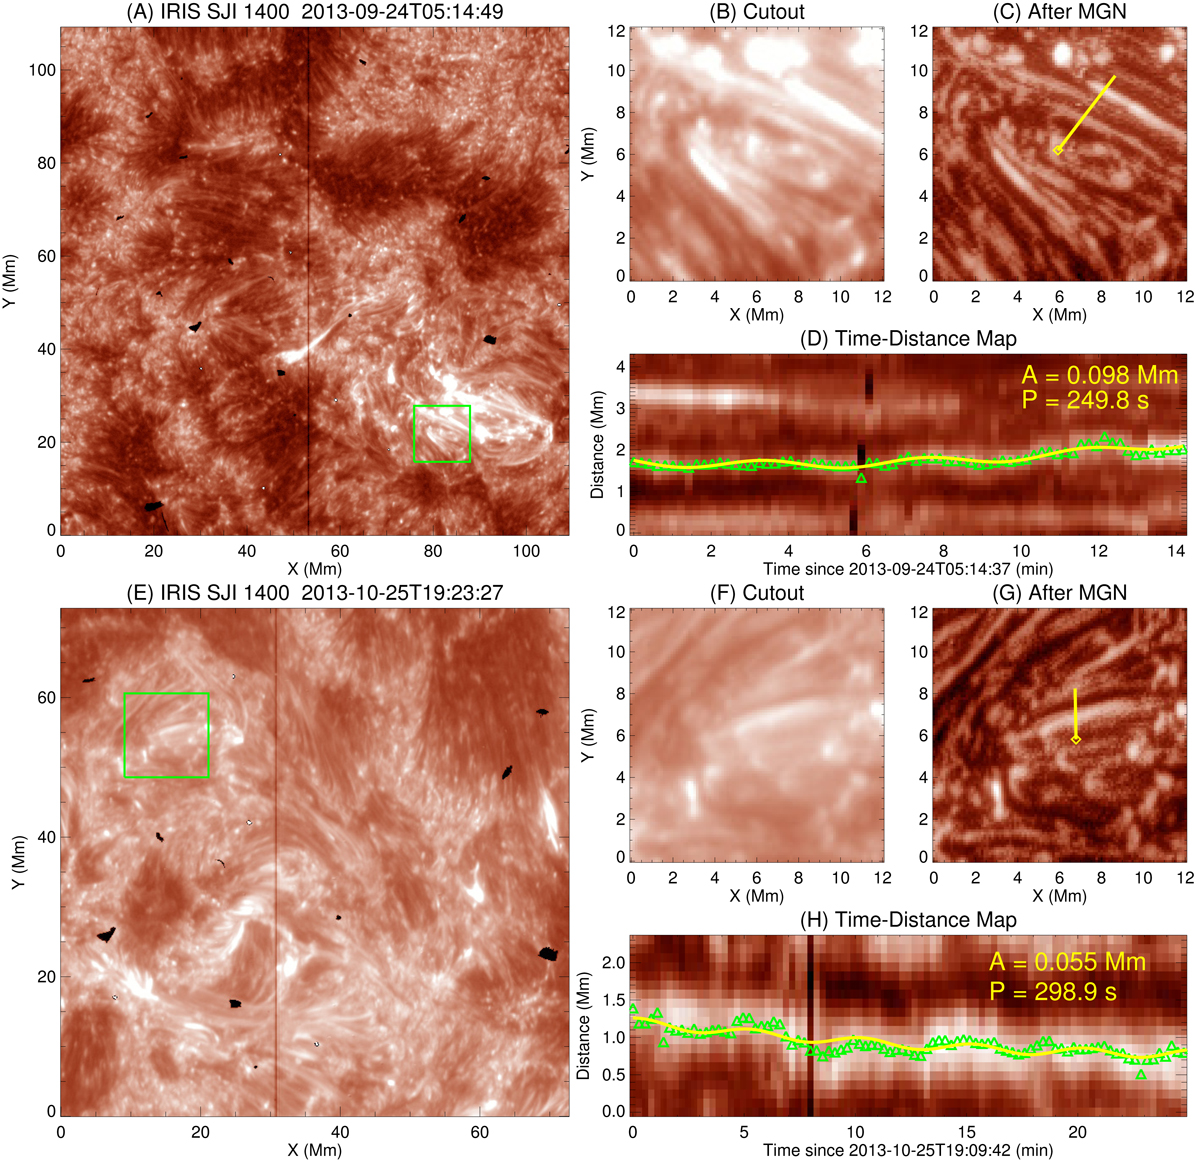
Fig. 1.
Download original image
Observation and analysis of oscillation events 1 and 5. The upper four panels (A–D) correspond to event 1 (starting from 05:14 UT on 2013 September 24). (A) The original IRIS SJ 1400 Å image showing the NOAA Active Region 11850. (B) Closer look at the region of interest, which is marked by a green box in (A). The cutout image processed by the MGN method is shown in (C). (D) Time–distance map constructed along the slit marked with a yellow line in (C). The distance starts at the bottom left of the slit indicated by a diamond symbol. In (D), the green triangles mark the position of the loop centre, and the yellow curve shows the fit result. The fitted displacement amplitude (A) and period (P) are indicated in the upper right corner. The lower four panels (E–H) are similar but correspond to event 5 (starting from 19:09UT on 2013 October 25).
Current usage metrics show cumulative count of Article Views (full-text article views including HTML views, PDF and ePub downloads, according to the available data) and Abstracts Views on Vision4Press platform.
Data correspond to usage on the plateform after 2015. The current usage metrics is available 48-96 hours after online publication and is updated daily on week days.
Initial download of the metrics may take a while.