Fig. 1.
Download original image
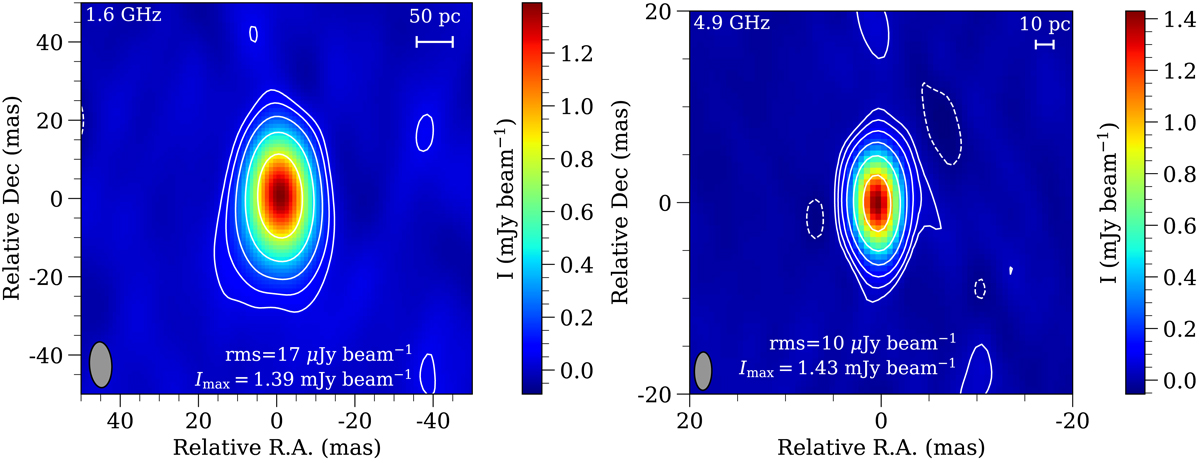
Naturally weighted VLBA images of J2331+1129 at 1.6 GHz (left) and 4.9 GHz (right). The intensity colour scales are displayed on the right-hand side of the panels. The lowest contours start at ±3σ rms noise, and the positive levels increase by a factor of 2. Image rms and peak intensity values are shown at the bottom of the panels, and the elliptical Gaussian restoring beams are shown in the lower left corners. The beam sizes are 11.7 mas × 5.7 mas and 4.0 mas × 1.8 mas (FWHM), with major axis position angles of ![]() and
and ![]() (measured from north through east) at 1.6 and 4.9 GHz, respectively.
(measured from north through east) at 1.6 and 4.9 GHz, respectively.
Current usage metrics show cumulative count of Article Views (full-text article views including HTML views, PDF and ePub downloads, according to the available data) and Abstracts Views on Vision4Press platform.
Data correspond to usage on the plateform after 2015. The current usage metrics is available 48-96 hours after online publication and is updated daily on week days.
Initial download of the metrics may take a while.