Fig. 3.
Download original image
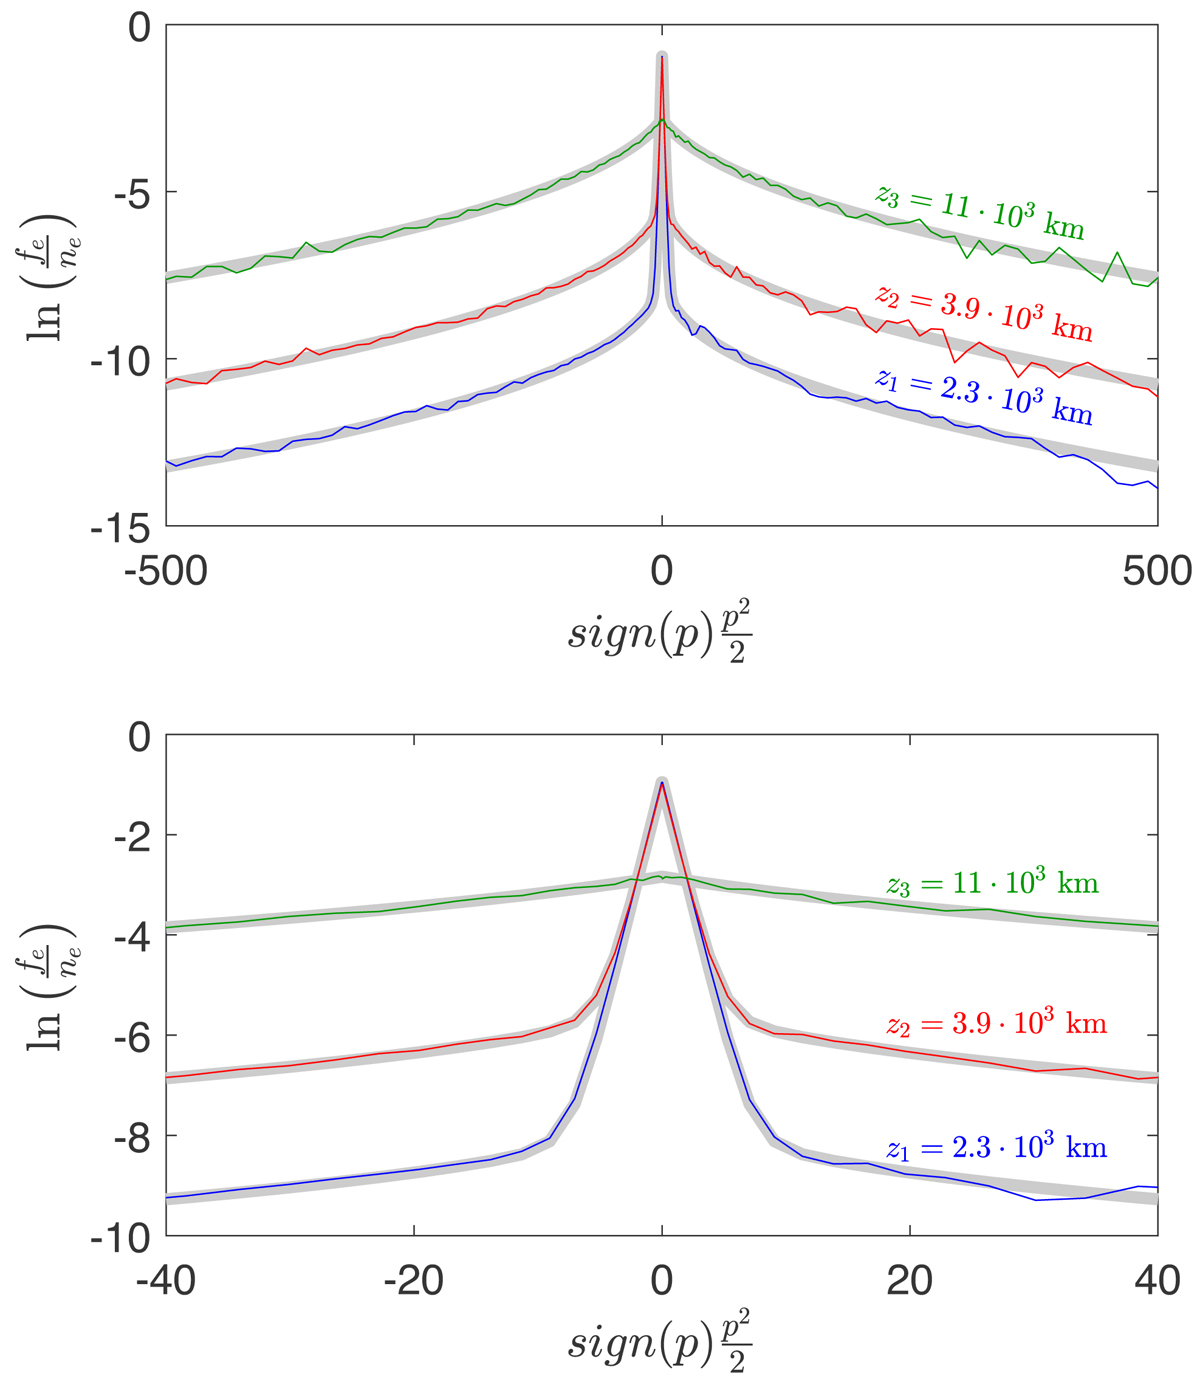
Electron VDFs (color curves) normalized by the electron densities as a function of the signed kinetic energy, at different heights (see labels). Theoretical VDFs computed from Eq. (11) are plotted as thick grey lines. Ion VDFs (not shown) are the same if plotted against sign(p)p2/2M. In the bottom panel, a magnification of the central region of the same VDFs is shown to highlight the disappearance of the Gaussian profile.
Current usage metrics show cumulative count of Article Views (full-text article views including HTML views, PDF and ePub downloads, according to the available data) and Abstracts Views on Vision4Press platform.
Data correspond to usage on the plateform after 2015. The current usage metrics is available 48-96 hours after online publication and is updated daily on week days.
Initial download of the metrics may take a while.