Open Access
Fig. 2.
Download original image
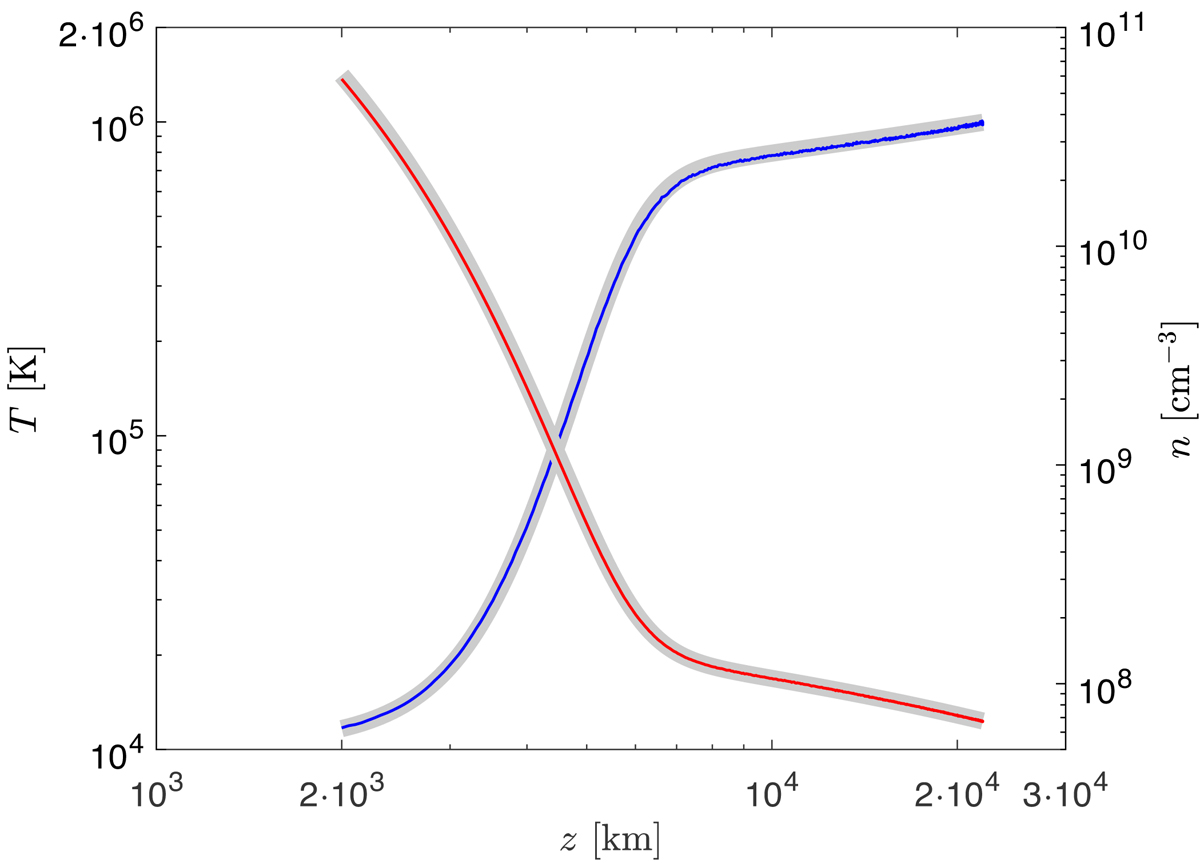
Electron density (red) and temperature (blue) as a function of the height above the photosphere, obtained in a numerical simulation with parameters corresponding to the solar atmosphere (see text). The thick grey lines are the theoretical profiles computed using Eq. (11). Ion profiles (not shown) are the same.
Current usage metrics show cumulative count of Article Views (full-text article views including HTML views, PDF and ePub downloads, according to the available data) and Abstracts Views on Vision4Press platform.
Data correspond to usage on the plateform after 2015. The current usage metrics is available 48-96 hours after online publication and is updated daily on week days.
Initial download of the metrics may take a while.