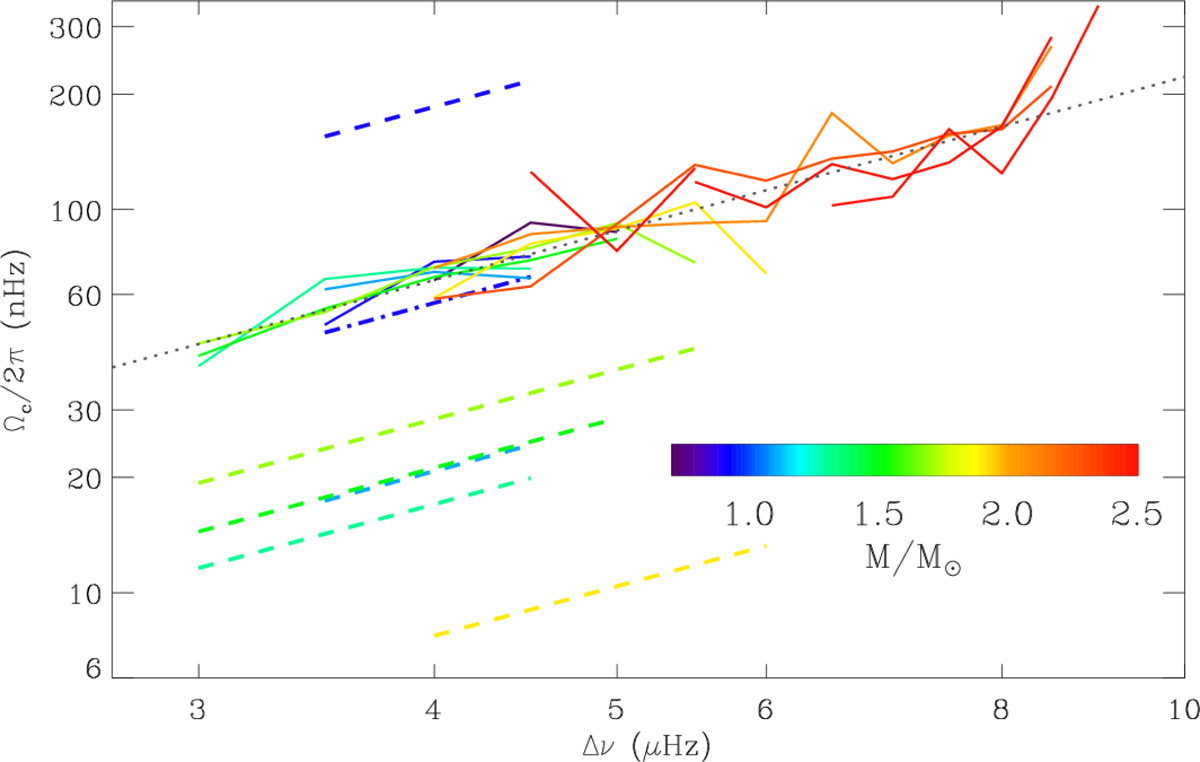
Fig. 5.
Download original image
Mean evolution of the core rotational splittings of RC stars as a function of the stellar mass, with bins of 0.2 M⊙ (full lines, with the same color code as in Fig. 4). The black dotted line shows a scaling as Δν4/3. Extrapolations of the mean rotation from the MS rotation rates are shown for similar mass bins (dashed lines). The blue dot-dashed line, for the [0.7, 0.9] M⊙ mass bin, takes a 0.2-M⊙ mass loss into account.
Current usage metrics show cumulative count of Article Views (full-text article views including HTML views, PDF and ePub downloads, according to the available data) and Abstracts Views on Vision4Press platform.
Data correspond to usage on the plateform after 2015. The current usage metrics is available 48-96 hours after online publication and is updated daily on week days.
Initial download of the metrics may take a while.