Fig. 2.
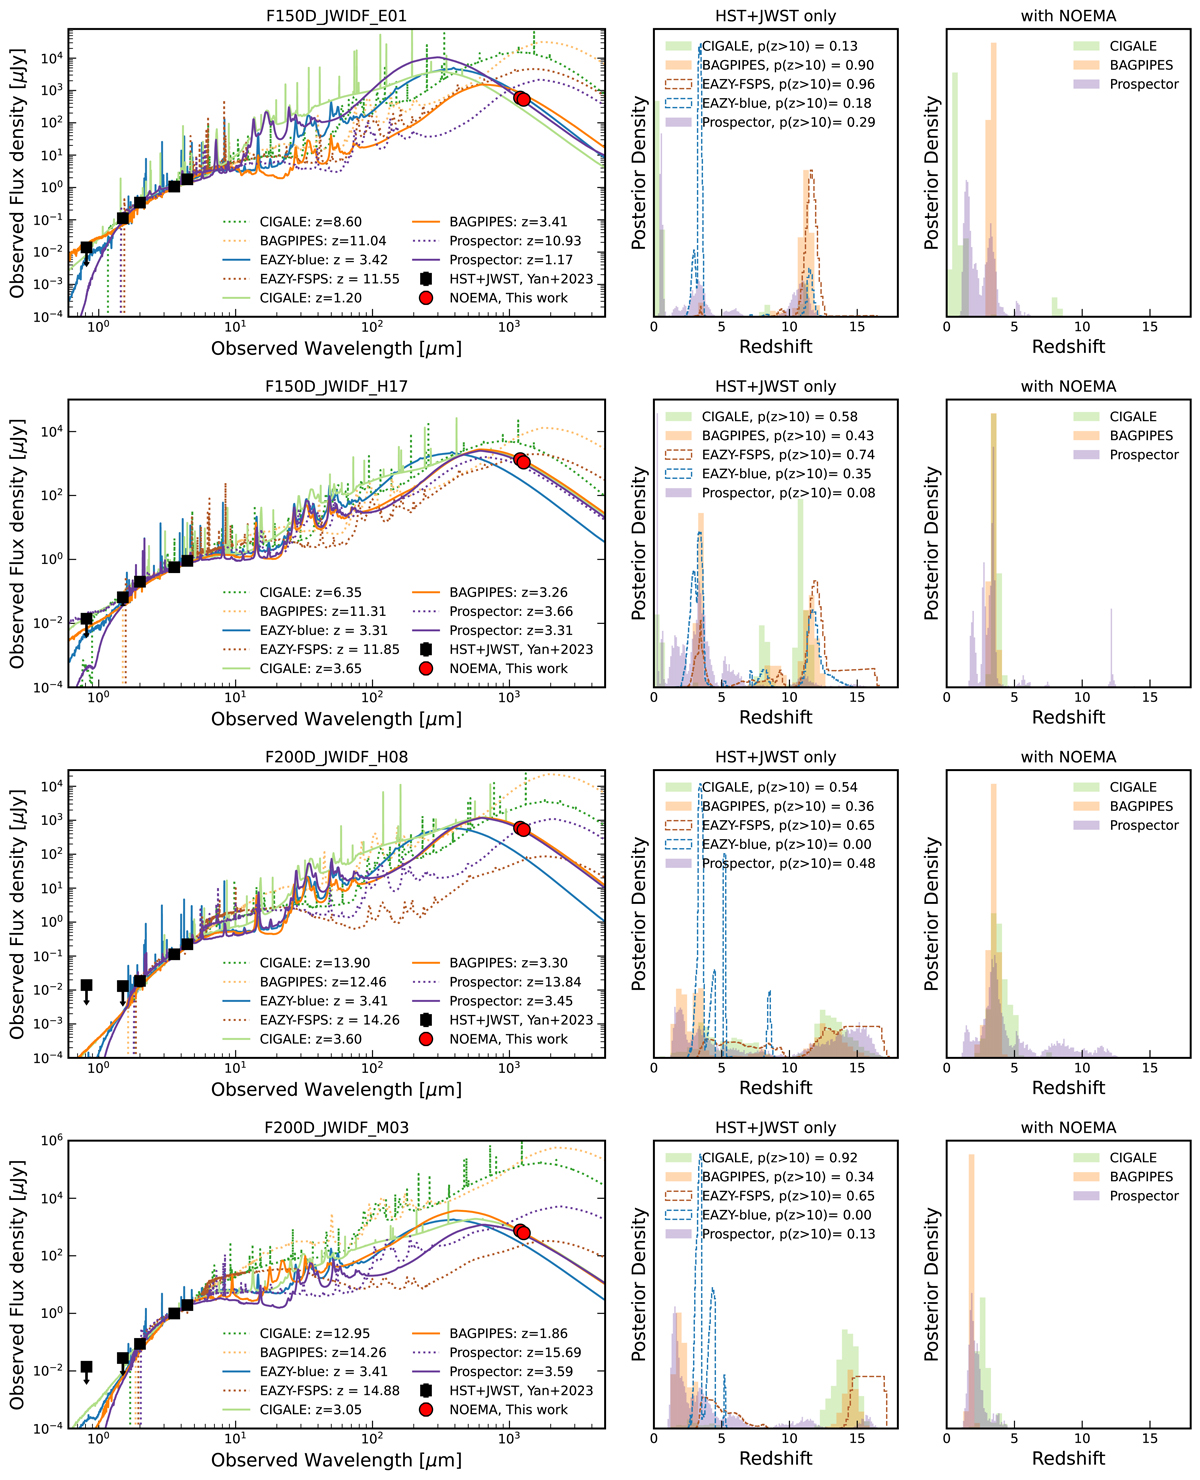
Download original image
SED and posterior redshift distributions of the four red 1.5–2.0 μm dropouts studied in this work. The best high-redshift SED using only the JWST+HST photometry are shown with dotted lines and the best-fit low-redshift solutions found including the NOEMA data are shown with full lines (left). In the absence of FIR constraints, the four JWST bands and the one HST (black squares and limits) band cannot constrain the redshift distribution and allow or prefer a z > 10 for most sources and codes (middle). The addition of the FIR constraints (red circles) break the degeneracies and clearly reveal the z ∼ 2 − 4 nature of these sources (right). Upper limits are shown at the two σ level.
Current usage metrics show cumulative count of Article Views (full-text article views including HTML views, PDF and ePub downloads, according to the available data) and Abstracts Views on Vision4Press platform.
Data correspond to usage on the plateform after 2015. The current usage metrics is available 48-96 hours after online publication and is updated daily on week days.
Initial download of the metrics may take a while.