Fig. 5
Download original image
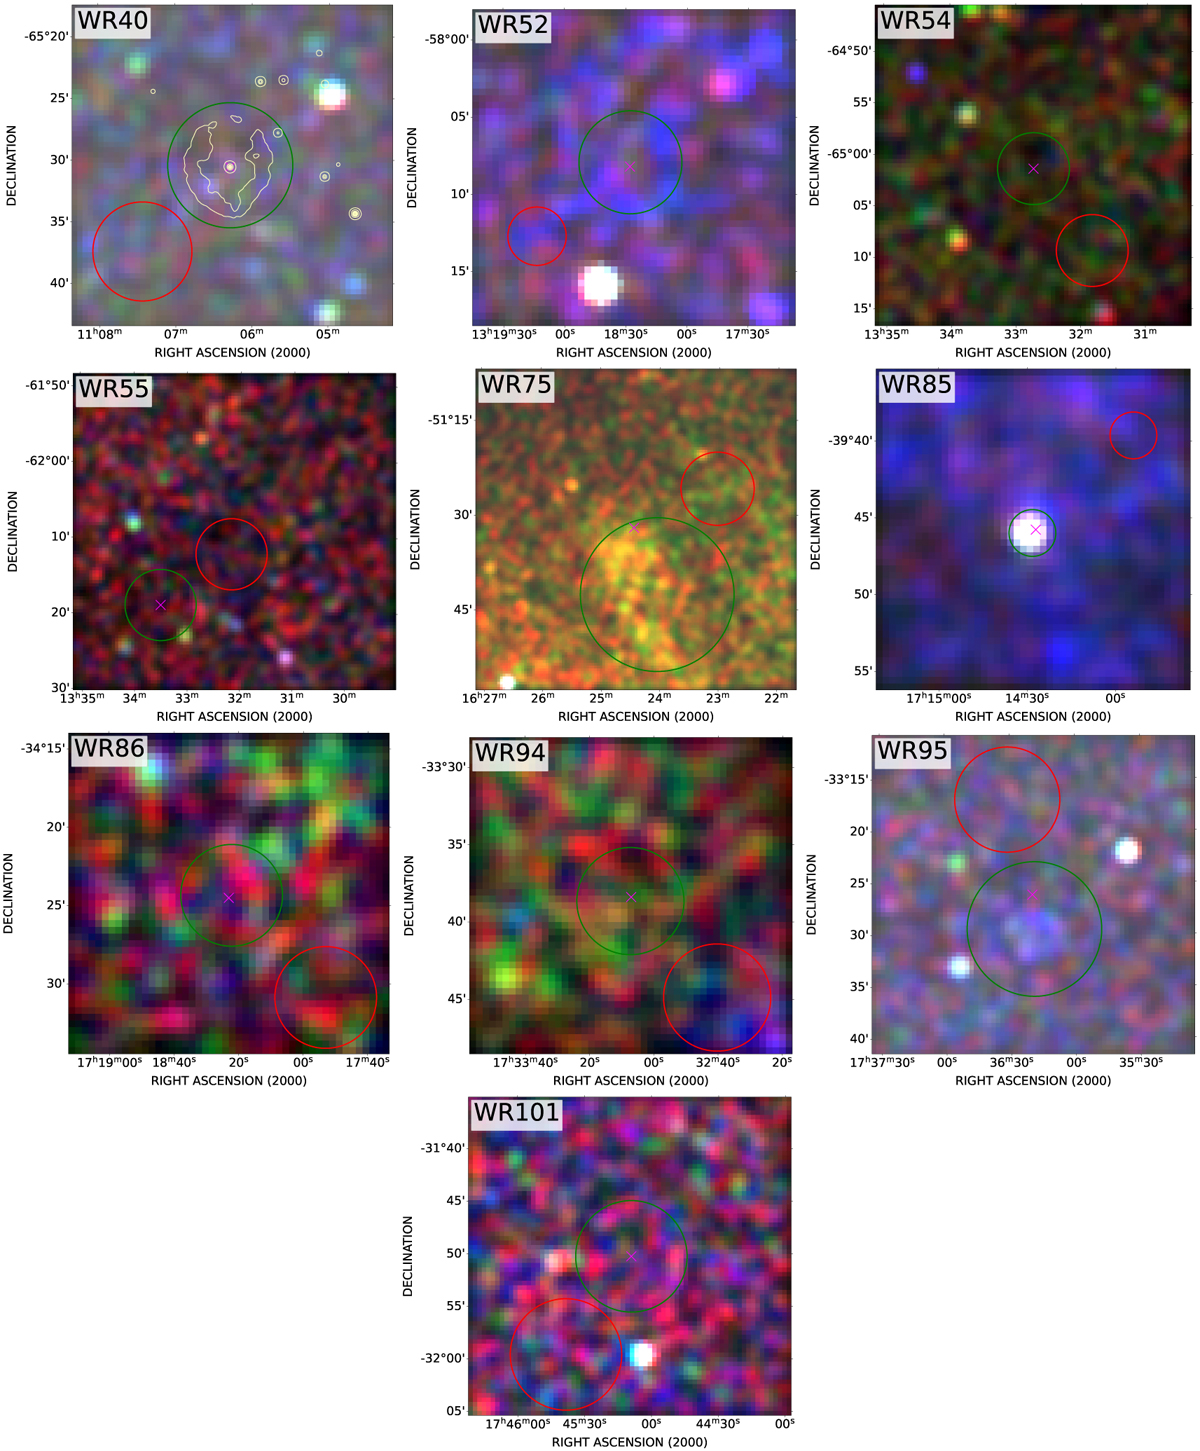
Exposure corrected images in X-rays (red: 0.2–0.7 keV. green: 0.7–1.1 keV, blue: 1.1–10 keV) of the regions surrounding the WR stars listed in Table 3. Top left: corresponding image from WR40 to WR101. We excluded the images of WR68 whose emission is contaminated by surrounding unrelated diffuse emission. In green and red, the source and background extraction regions are shown, respectively, employed for the flux estimation (Table 3). In yellow, we show the WISE contours only for the most representative bubbles. A magenta cross indicates the position of the WR star.
Current usage metrics show cumulative count of Article Views (full-text article views including HTML views, PDF and ePub downloads, according to the available data) and Abstracts Views on Vision4Press platform.
Data correspond to usage on the plateform after 2015. The current usage metrics is available 48-96 hours after online publication and is updated daily on week days.
Initial download of the metrics may take a while.