Fig. 9.
Download original image
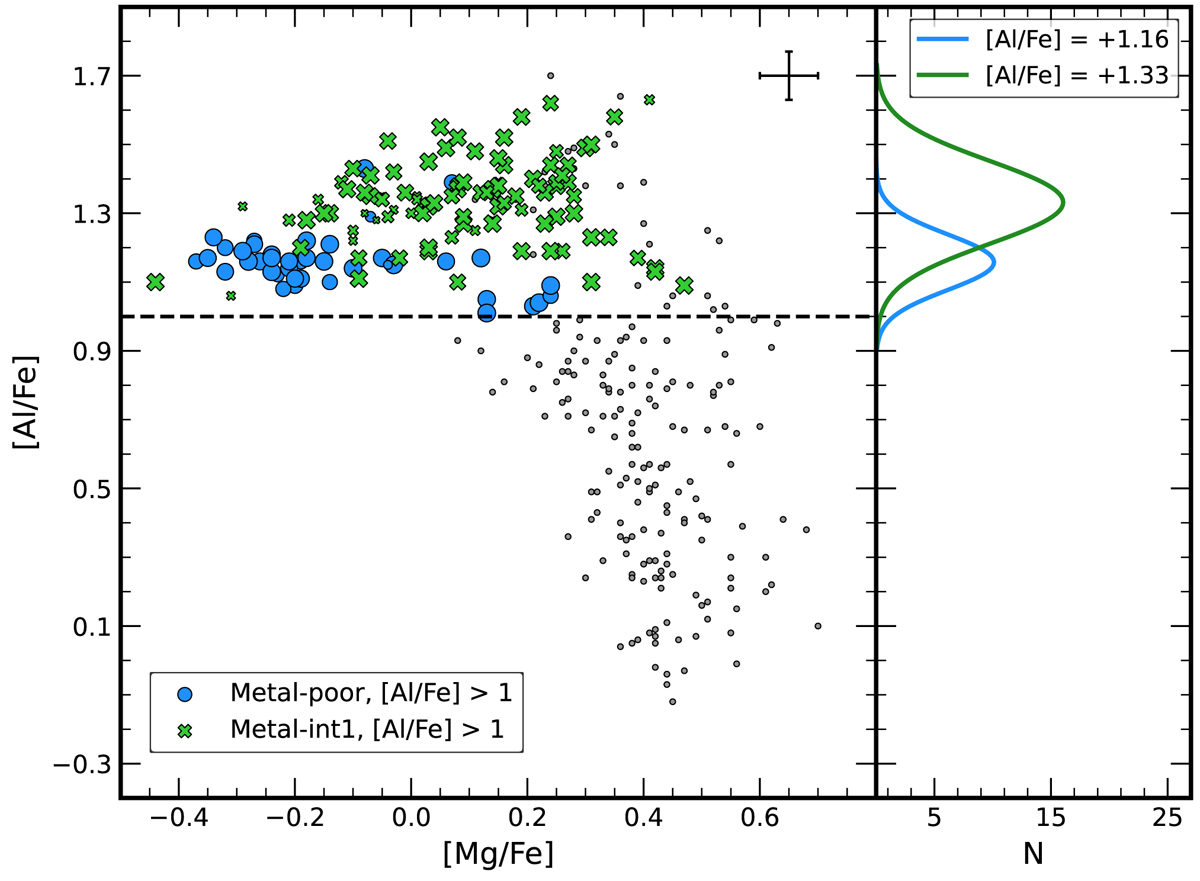
Trend of [Mg/Fe] as a function of [Al/Fe] for the stars analyzed in this study. The blue dots and the green crosses represent the MP and M-int1 stars with [Al/Fe] > 1 dex, respectively. The gray dots represent the entire sample. The error bar in the top-right corner represents the typical measurement error associated with the data. The dashed line indicates the value [Al/Fe] = 1 dex. The distributions of the two subsamples are shown in the right panel with the corresponding colors.
Current usage metrics show cumulative count of Article Views (full-text article views including HTML views, PDF and ePub downloads, according to the available data) and Abstracts Views on Vision4Press platform.
Data correspond to usage on the plateform after 2015. The current usage metrics is available 48-96 hours after online publication and is updated daily on week days.
Initial download of the metrics may take a while.