Open Access
Fig. 2.
Download original image
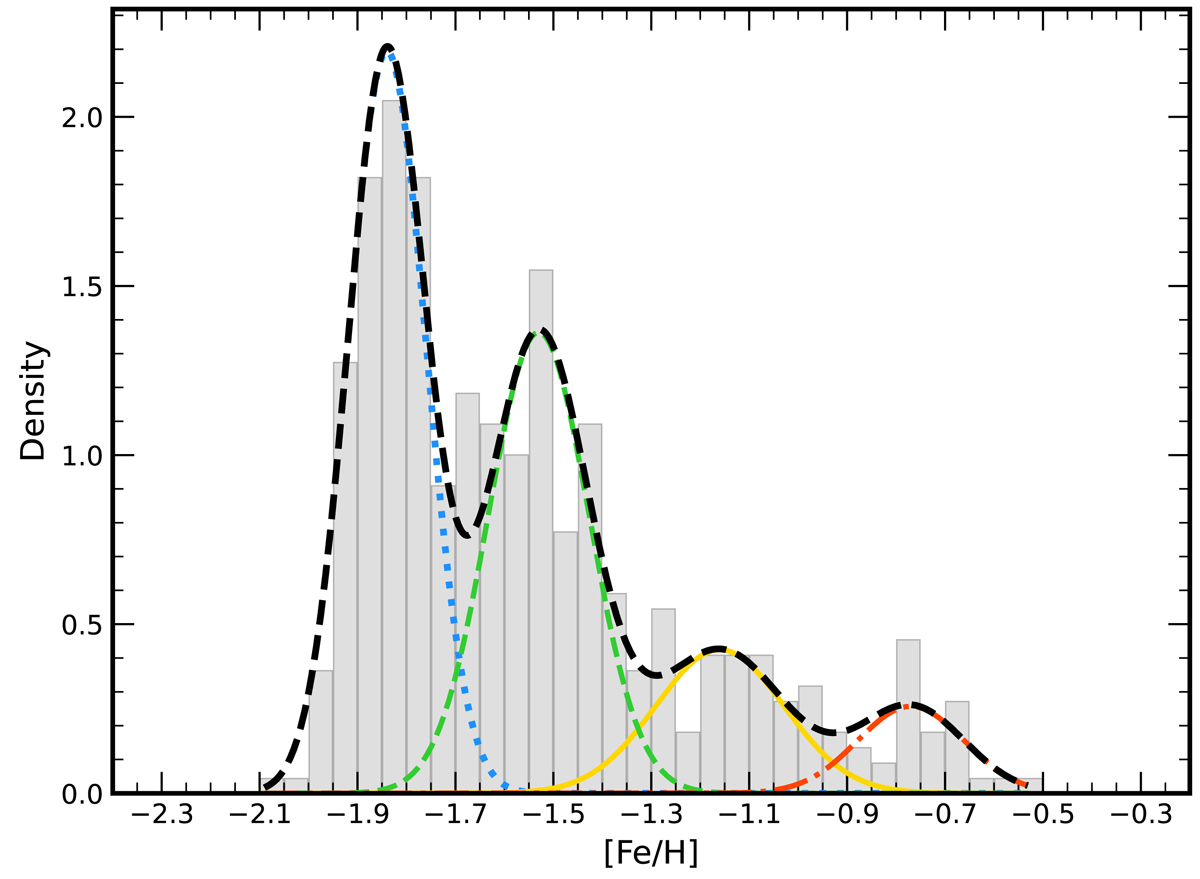
Histogram displaying the MDF of ω Centauri. Also shown as a dashed black line is the Gaussian kernel fit of the distribution. Four Gaussian components can be identified. They represent the MP, M-int1, M-int2, and MR subpopulations, and are plotted in the figure as dotted, dashed, solid, and dash-dotted lines, respectively.
Current usage metrics show cumulative count of Article Views (full-text article views including HTML views, PDF and ePub downloads, according to the available data) and Abstracts Views on Vision4Press platform.
Data correspond to usage on the plateform after 2015. The current usage metrics is available 48-96 hours after online publication and is updated daily on week days.
Initial download of the metrics may take a while.