Fig. 11.
Download original image
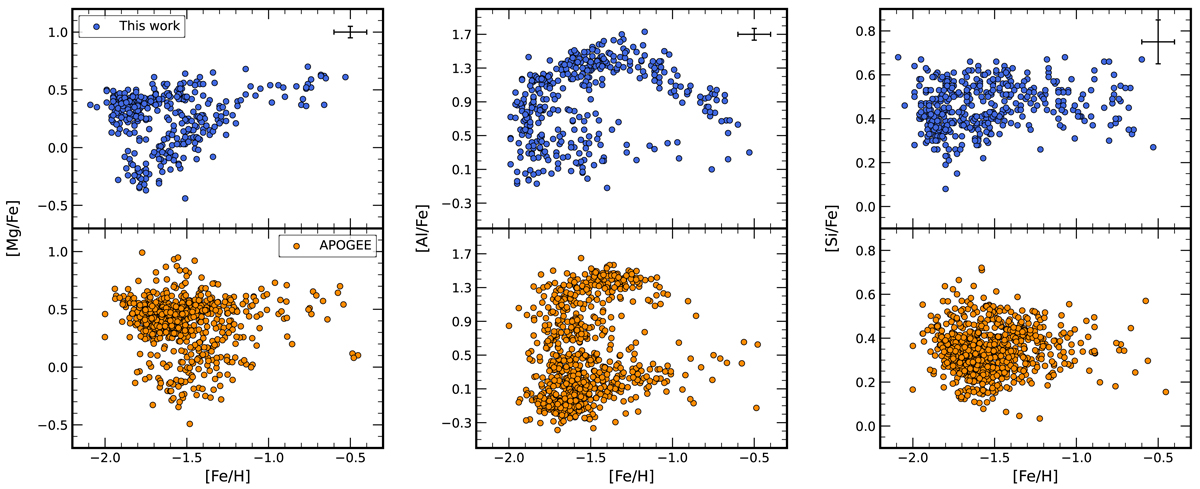
Distribution of [Mg/Fe] (left panel), [Al/Fe] (middle panel), and [Si/Fe] (right panel) as a function of [Fe/H]. In the top are displayed the stars here analyzed (blue dots), while in the bottom the stars analyzed by Mészáros et al. (2021; orange dots). The error bar in the top-right corner in the top figures represents the typical error associated with the measurements.
Current usage metrics show cumulative count of Article Views (full-text article views including HTML views, PDF and ePub downloads, according to the available data) and Abstracts Views on Vision4Press platform.
Data correspond to usage on the plateform after 2015. The current usage metrics is available 48-96 hours after online publication and is updated daily on week days.
Initial download of the metrics may take a while.