Fig. 3
Download original image
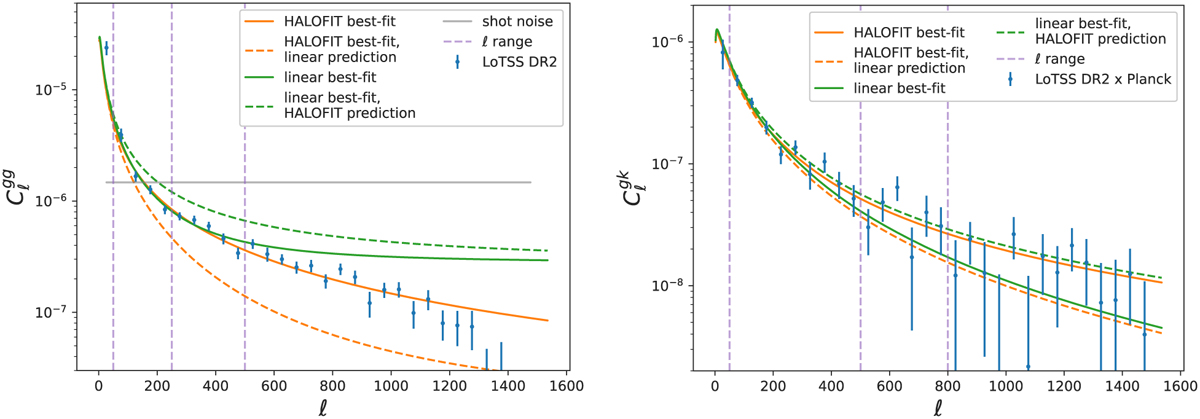
Comparison of the linear and <mono>HALOFIT</mono> matter power spectrum for the auto- and cross-correlation (left and right, respectively). We note that the shot noise is reported for each multipole separately, while the correlation signal is calculated in the bins of 50 multipoles. The solid lines show the best-fit results with different 3D power spectrum models, while dashed lines show the models with the same resulting best-fit parameters as obtained for solid lines, but with only matter power spectrum changed to the other model. Hence, the difference between the corresponding solid and dashed lines stems only from a difference between linear and <mono>HALOFIT</mono> models. The vertical dashed lines mark the multipole ranges used in this analysis: the fiducial 50 ≤ ℓ ≤ 250 and 50 ≤ ℓ ≤ 500, as well as larger 50 ≤ ℓ ≤ 500 and 50 ≤ ℓ ≤ 800, for ![]() and
and ![]() respectively. The fits shown here were made on the fiducial multipole range, where differences between the linear and <mono>HALOFIT</mono> models are between 1σ – 2σ of errors on data measurements.
respectively. The fits shown here were made on the fiducial multipole range, where differences between the linear and <mono>HALOFIT</mono> models are between 1σ – 2σ of errors on data measurements.
Current usage metrics show cumulative count of Article Views (full-text article views including HTML views, PDF and ePub downloads, according to the available data) and Abstracts Views on Vision4Press platform.
Data correspond to usage on the plateform after 2015. The current usage metrics is available 48-96 hours after online publication and is updated daily on week days.
Initial download of the metrics may take a while.