Fig. 2
Download original image
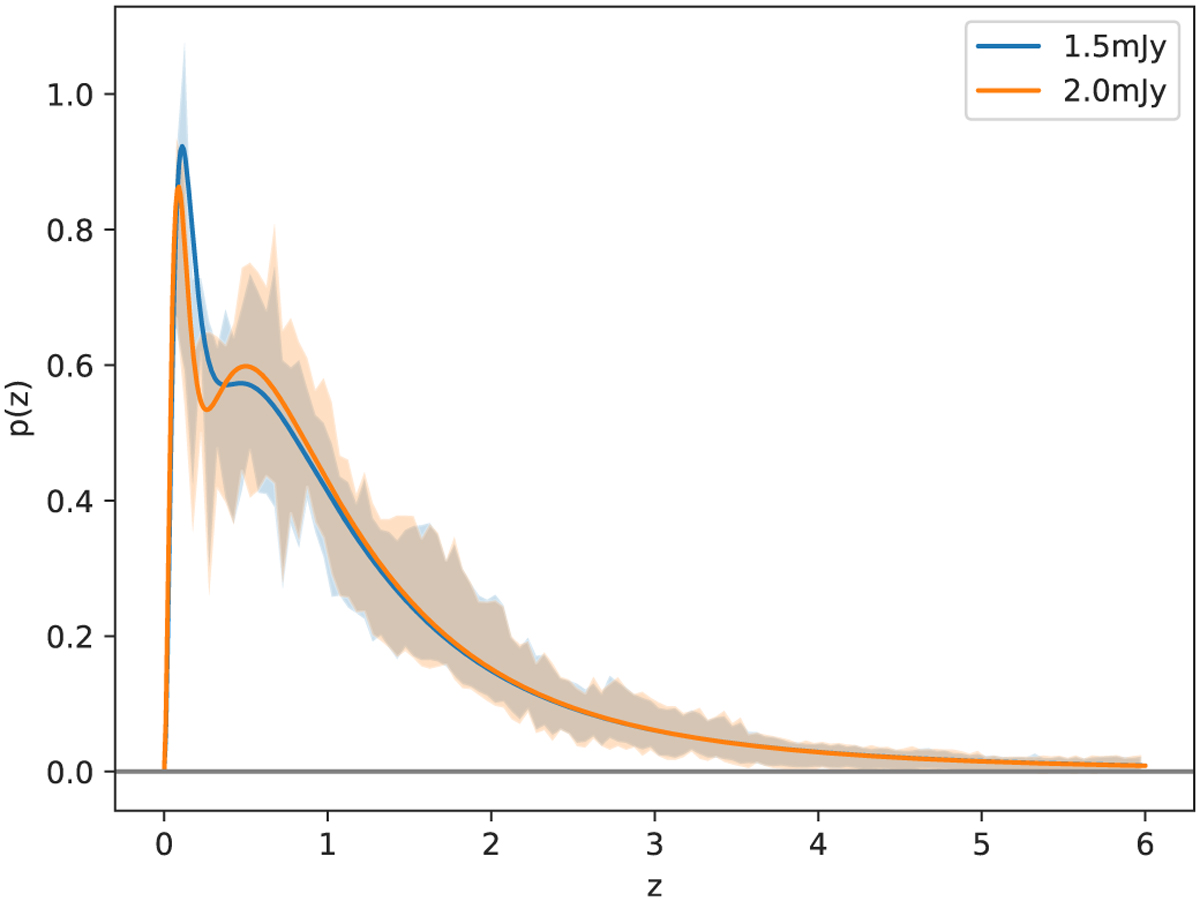
Redshift distribution based on the three deep fields located within the LoTSS DR2 footprint, for 2mJy and 1.5 mJy flux cuts. The thick lines show the models fitted with Eq. (14), and the shaded areas are a 1σ region from the deep fields measurements. The redshift distribution is limited to z < 6.
Current usage metrics show cumulative count of Article Views (full-text article views including HTML views, PDF and ePub downloads, according to the available data) and Abstracts Views on Vision4Press platform.
Data correspond to usage on the plateform after 2015. The current usage metrics is available 48-96 hours after online publication and is updated daily on week days.
Initial download of the metrics may take a while.