Fig. 7.
Download original image
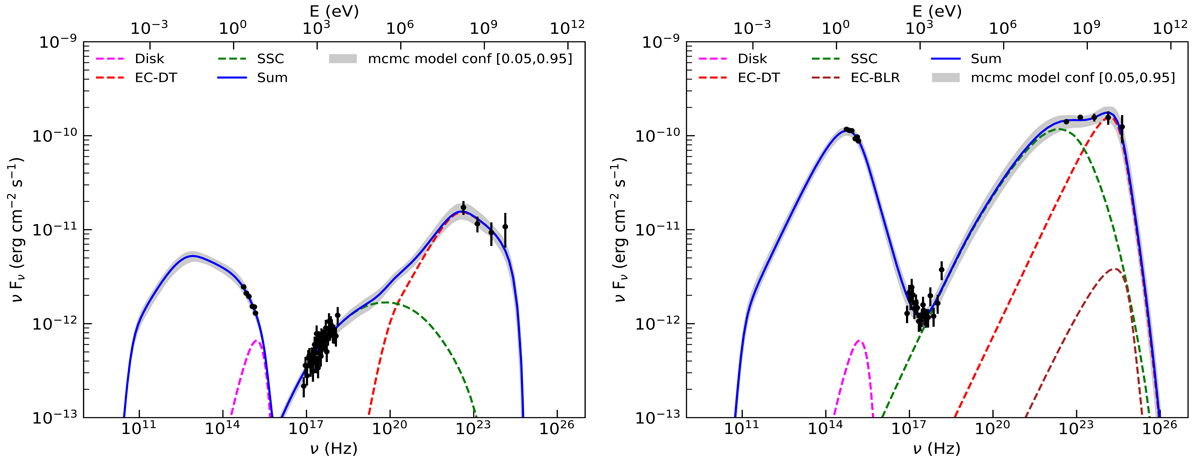
Model-fit broadband SEDs of B2 1308+326 in the quiescent (left panel) and flaring (right panel) states. The solid blue curve represents the sum of all the components, while the grey shaded region denotes the uncertainty region from MCMC sampling of the model parameters. The legends provide the colour-coding for the other components.
Current usage metrics show cumulative count of Article Views (full-text article views including HTML views, PDF and ePub downloads, according to the available data) and Abstracts Views on Vision4Press platform.
Data correspond to usage on the plateform after 2015. The current usage metrics is available 48-96 hours after online publication and is updated daily on week days.
Initial download of the metrics may take a while.