Fig. 4.
Download original image
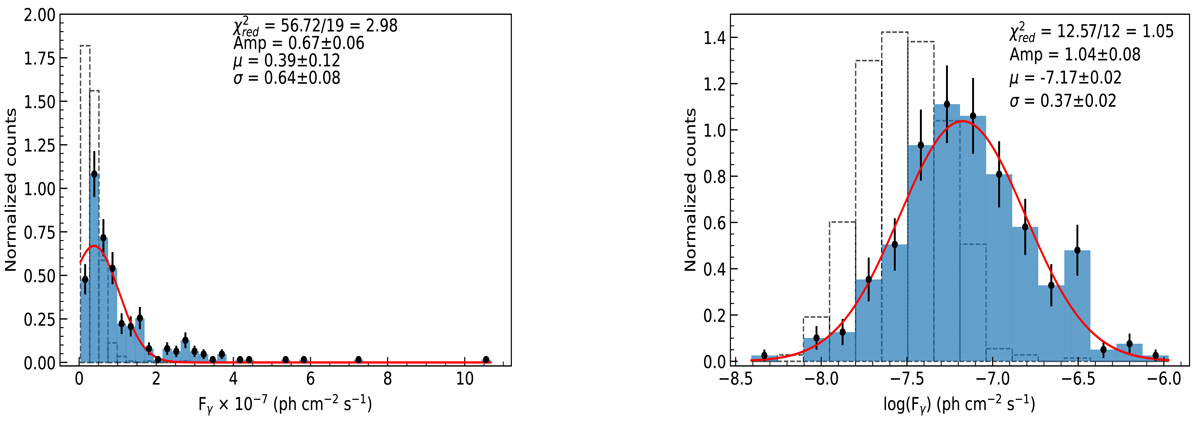
Gamma-ray flux distribution of B2 1308+326 for the entire ∼14 yr monitoring period. Left panel: flux distribution fitted with a Gaussian function on a linear scale (normal distribution). Right panel: flux distribution fitted with a Gaussian function on a logarithmic scale (log-normal distribution). The results of the fits are mentioned in each plot. The distribution of the upper limits is shown as dashed bars.
Current usage metrics show cumulative count of Article Views (full-text article views including HTML views, PDF and ePub downloads, according to the available data) and Abstracts Views on Vision4Press platform.
Data correspond to usage on the plateform after 2015. The current usage metrics is available 48-96 hours after online publication and is updated daily on week days.
Initial download of the metrics may take a while.