Open Access
Fig. 1.
Download original image
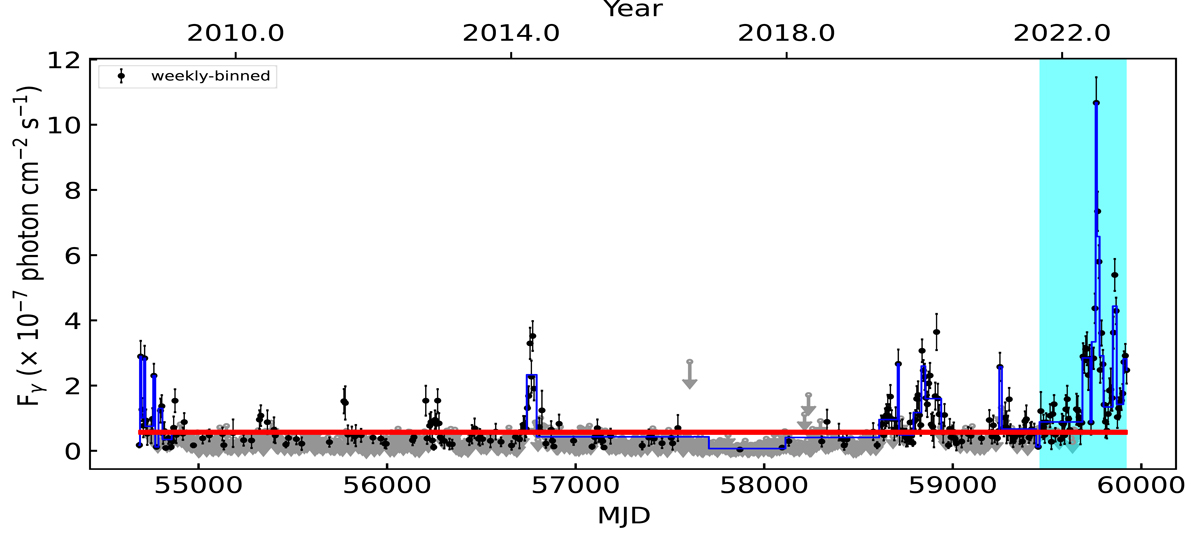
Weekly averaged γ-ray light curves of B2 1308+326 covering a period of ∼14 yr. The horizontal red band gives the average flux (5.69 × 10⁻⁸ ph cm−2 s−1) with 1σ uncertainty, and the solid blue line delineates the Bayesian blocks. The shaded region represents the outburst phase.
Current usage metrics show cumulative count of Article Views (full-text article views including HTML views, PDF and ePub downloads, according to the available data) and Abstracts Views on Vision4Press platform.
Data correspond to usage on the plateform after 2015. The current usage metrics is available 48-96 hours after online publication and is updated daily on week days.
Initial download of the metrics may take a while.