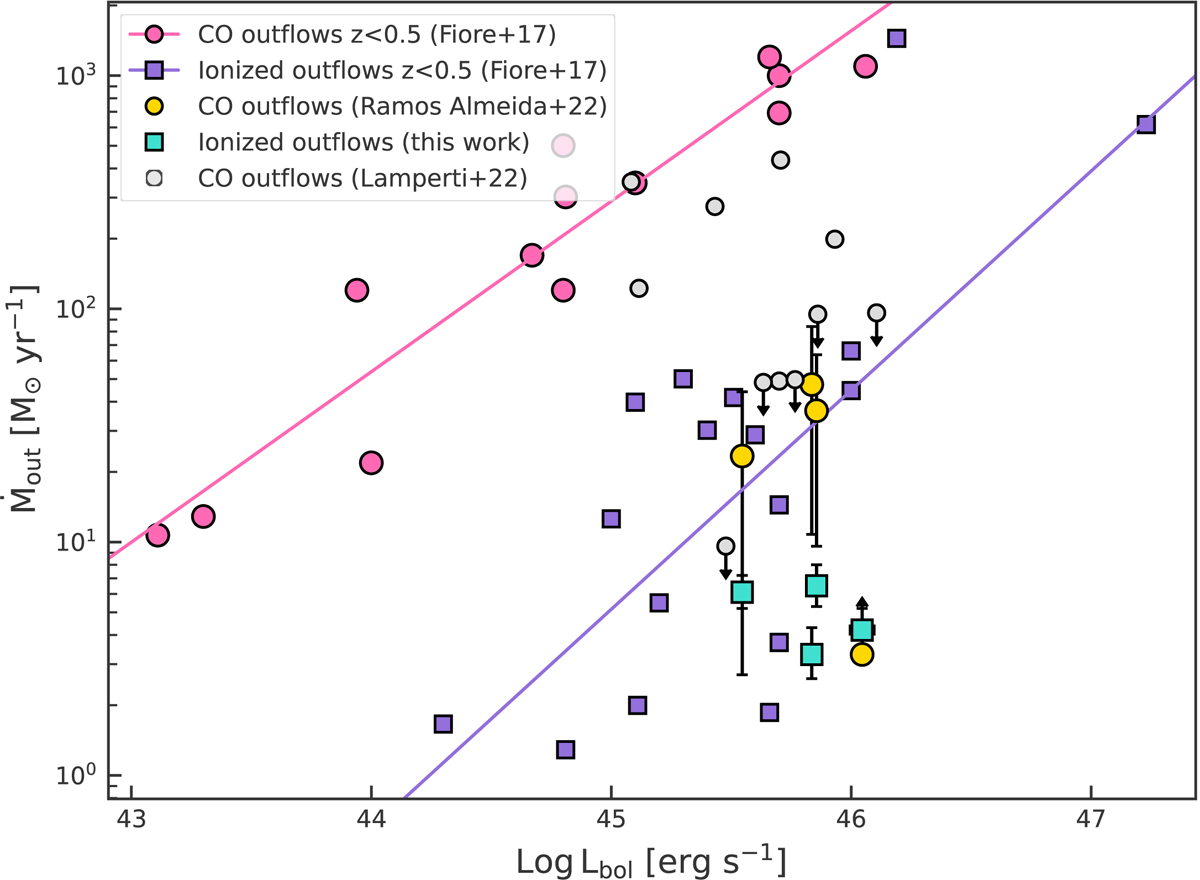
Fig. 9.
Download original image
Ionized and cold molecular gas mass outflow rates versus AGN luminosity. The purple and cyan squares are the same as in Fig. 8, and the pink circles are the cold molecular outflow measurements from Fiore et al. (2017). The corresponding linear fits are indicated with the same colors. The yellow circles are the cold molecular mass outflow rates reported by Ramos Almeida et al. (2022) for the same QSO2s analyzed in this work, and the grey circles AGN-dominated ULIRGs from Lamperti et al. (2022).
Current usage metrics show cumulative count of Article Views (full-text article views including HTML views, PDF and ePub downloads, according to the available data) and Abstracts Views on Vision4Press platform.
Data correspond to usage on the plateform after 2015. The current usage metrics is available 48-96 hours after online publication and is updated daily on week days.
Initial download of the metrics may take a while.