Fig. 8.
Download original image
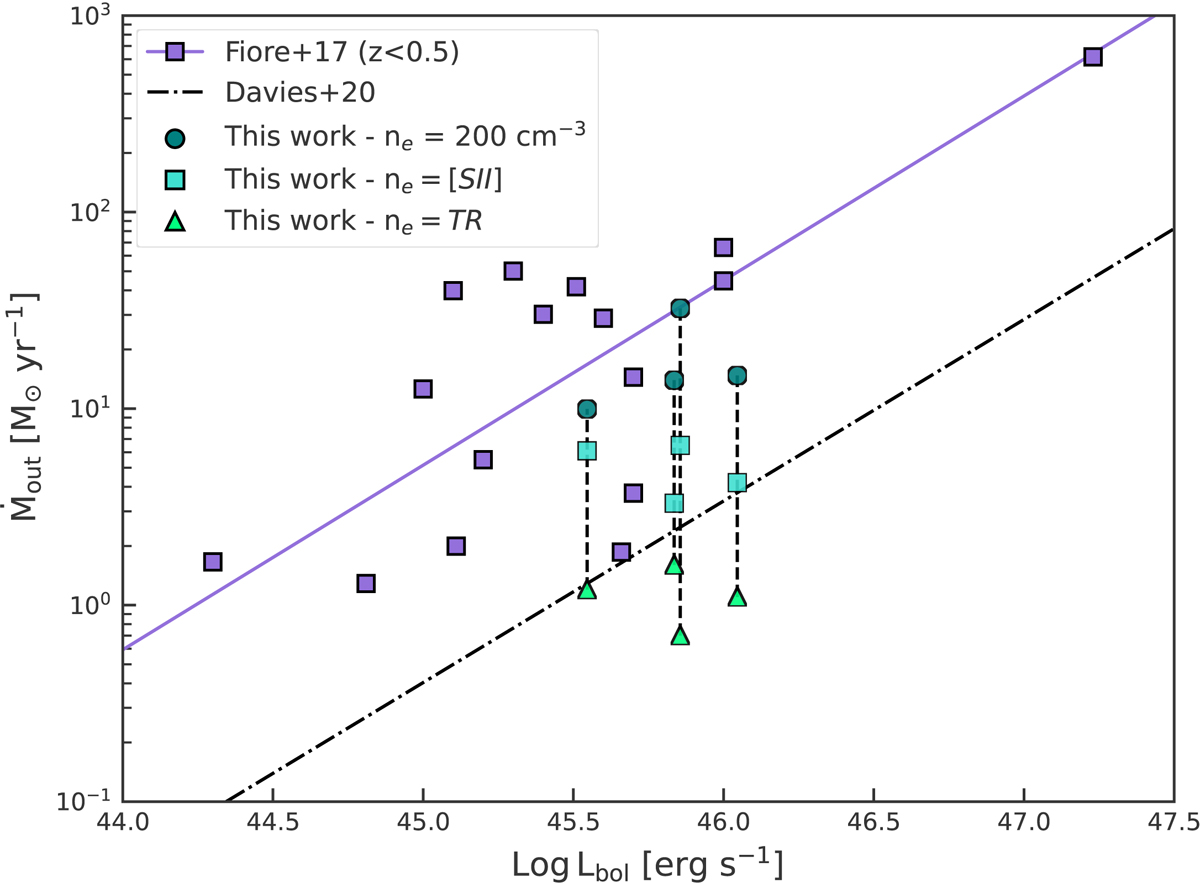
Mass outflow rate versus AGN luminosity. The purple line corresponds to the linear fit of the ionized outflow mass rates calculated by Fiore et al. (2017) for a sample of AGN at z < 0.5 (purple squares) assuming a value of the density of 200 cm−3. The black dot-dashed line corresponds to the linear fit from Davies et al. (2020), that includes the mass rates of Fiore et al. (2017), but corrected by using individual electron densities. The other symbols correspond to the four QSO2s with spatially resolved [O III] outflows, with different shapes and colors indicating the values of ne adopted to perform the outflow mass rate calculations: green circles correspond to densities of 200 cm−3, and cyan squares and light-green triangles to those measured from the [S II] doublet and the trans-auroral lines, respectively. The outflow mass rates of the QSO2s vary up to 2 orders of magnitudes depending on how the ne is measured.
Current usage metrics show cumulative count of Article Views (full-text article views including HTML views, PDF and ePub downloads, according to the available data) and Abstracts Views on Vision4Press platform.
Data correspond to usage on the plateform after 2015. The current usage metrics is available 48-96 hours after online publication and is updated daily on week days.
Initial download of the metrics may take a while.