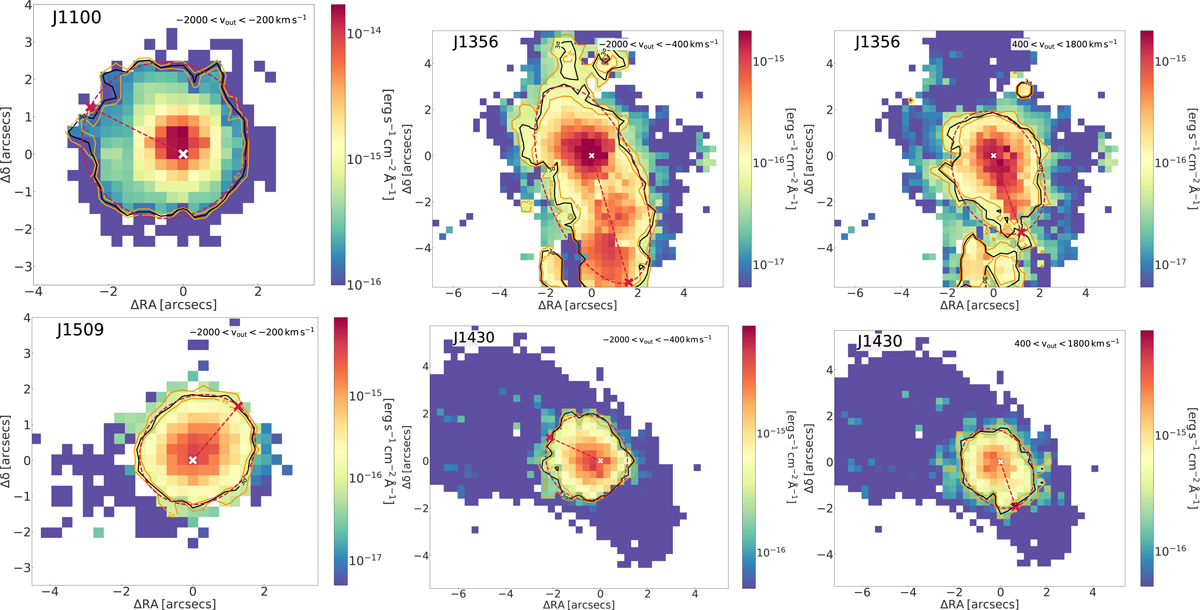
Fig. 6.
Download original image
[O III] flux maps corresponding to high-velocity gas only, with velocities between −2000 < vout < − 200 km s−1, −2000 < vout < − 400 km s−1, and 400 < vout < 1800 km s−1 depending on the source. The black solid line corresponds to the flux contour at 3σ and the red dashed line to the ellipse fit to it. The white cross indicates the [O III] emission peak, and the red cross corresponds to the most distant point from the white cross within the fit ellipse. The distance between the two crosses is the maximum outflow radius (Rout) reported in Table 4. The two orange lines are the flux contours at the 2σ and 4σ levels used to estimate the errors of the outflow radius and flux.
Current usage metrics show cumulative count of Article Views (full-text article views including HTML views, PDF and ePub downloads, according to the available data) and Abstracts Views on Vision4Press platform.
Data correspond to usage on the plateform after 2015. The current usage metrics is available 48-96 hours after online publication and is updated daily on week days.
Initial download of the metrics may take a while.