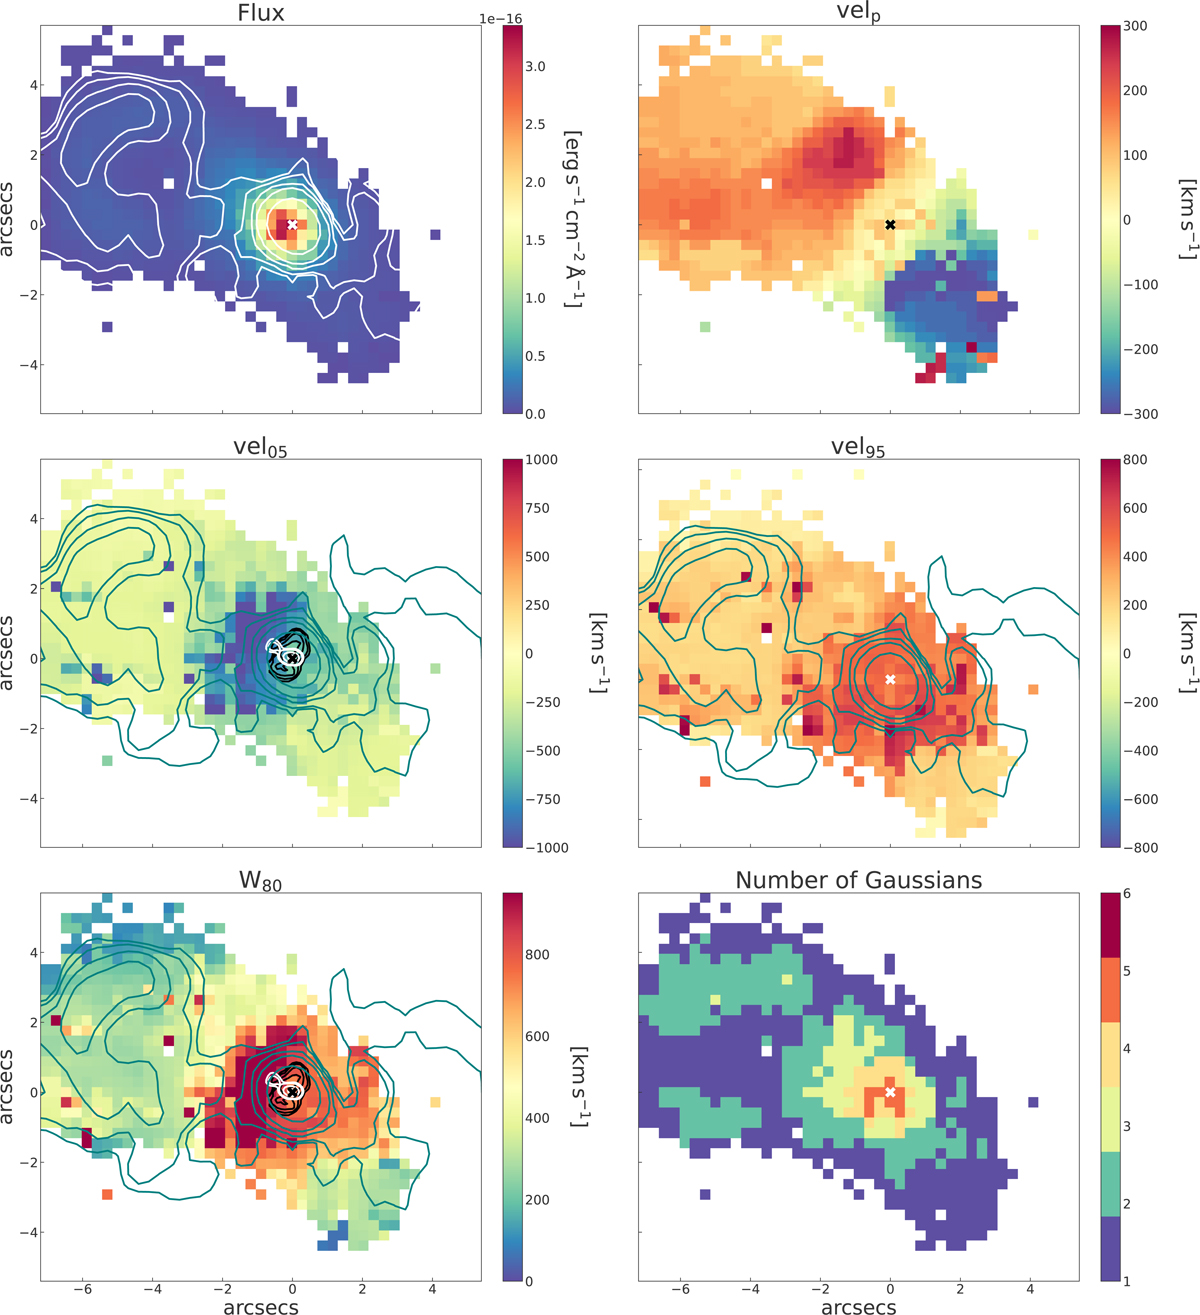
Fig. 5.
Download original image
Kinematic maps obtained from the nonparametric analysis of the [O III] emission line profiles of J1430. Top panels: integrated flux on the left, with the ∼1″ resolution 6 GHz VLA contours at 3,5,10,20, and 60σ from Jarvis et al. (2019) superimposed (white solid lines), and velp on the right, which traces the narrow component. Middle panels: vel05 (left) and vel95 (right), which trace blueshifted and redshifted outflowing gas. The same 6 GHz contours shown in the flux map are shown in cyan, and the ∼0.25″ resolution 6 GHz VLA contours at 3, 5, 15, 30, and 60σ from Jarvis et al. (2019) are shown in solid white. The black contours correspond to the brightness temperature ratio (T32/T21) from ALMA CO observations at 0.5″ resolution (Audibert et al. 2023). Bottom panels: W80 on the left, with the same contours as in the vel05 map, and the number of Gaussians fit in each spaxel on the right. White and black crosses indicate the AGN location, defined as the maximum of the [O III] emission. North is up and east to the left.
Current usage metrics show cumulative count of Article Views (full-text article views including HTML views, PDF and ePub downloads, according to the available data) and Abstracts Views on Vision4Press platform.
Data correspond to usage on the plateform after 2015. The current usage metrics is available 48-96 hours after online publication and is updated daily on week days.
Initial download of the metrics may take a while.