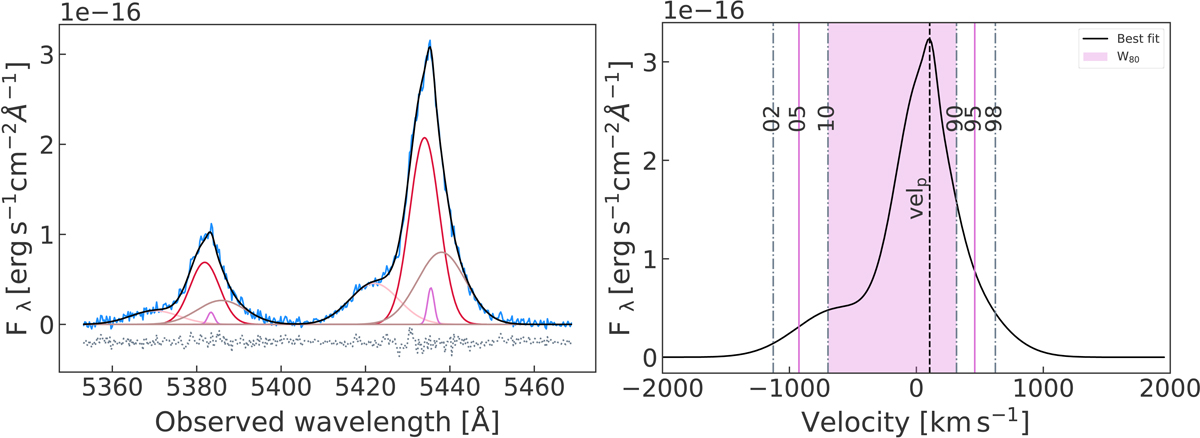
Fig. 4.
Download original image
Example of nonparametric analysis of a random spaxel of J1430. Left panel: [O III]λλ5459,5007 Å continuum subtracted emission lines, with the observed spectrum shown in blue, the best fit model in black, and the corresponding residuals in grey. The same number of Gaussians (four in this case) with the same kinematics and a flux ratio of 2.98 are fit for each line of the doublet. Right panel: corresponding model of the [O III]λ5007 Å line, obtained from the fit shown in the left panel, with W80 indicated as the pink shaded region, vel05 and vel95 indicated by the pink vertical lines, and the upper (vel02 and vel98) and lower bounds (vel10 and vel90) marked by the dot-dashed vertical gray lines. The dashed vertical black line represents the velocity at the [O III] peak (velp).
Current usage metrics show cumulative count of Article Views (full-text article views including HTML views, PDF and ePub downloads, according to the available data) and Abstracts Views on Vision4Press platform.
Data correspond to usage on the plateform after 2015. The current usage metrics is available 48-96 hours after online publication and is updated daily on week days.
Initial download of the metrics may take a while.